

Women make up nearly half of the U.S. workforce, and in 2025 about 74% of moms with children under age 18 were employed. Despite their strong presence in the labor market, working mothers still face significant challenges. On average, women earn only about 82% of what men make per hour, and just 9.4% of chief executives at S&P 500 companies are women. These disparities raise not only financial concerns but also broader social questions about whether women are still expected to choose between building a career and raising a family.
A key issue is how effectively these challenges are being addressed. Progress varies widely across the country, as parental leave policies and other legal protections differ from state to state. In addition, the quality of essential support systems — such as affordable child care and strong public schools — is far from consistent nationwide.
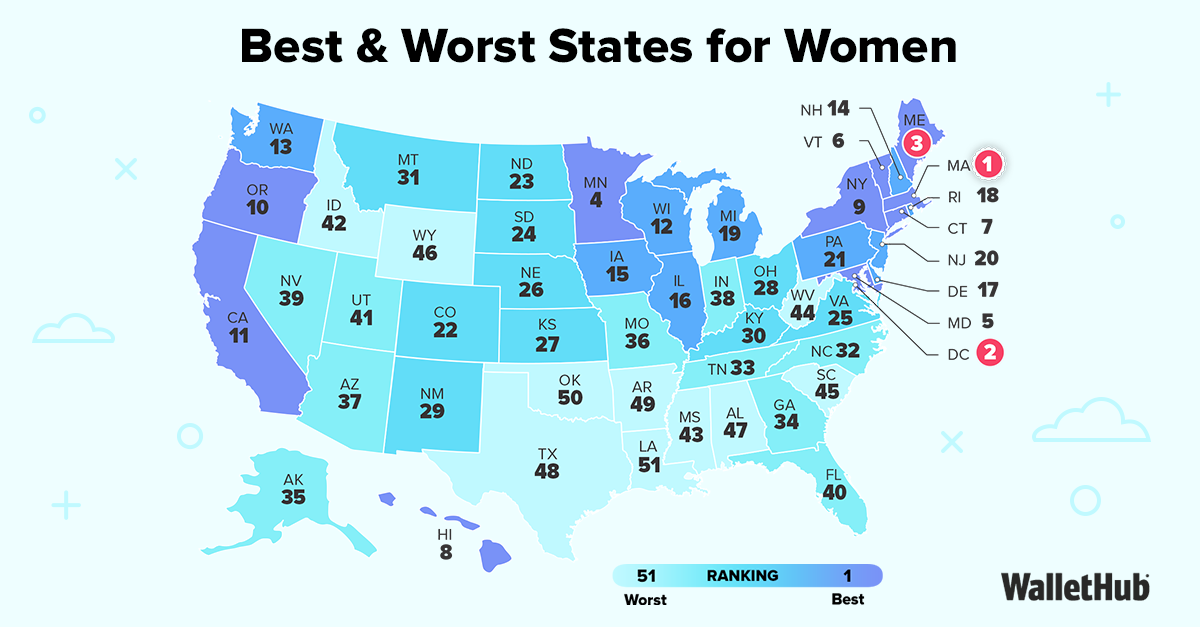
To highlight where working mothers have the best and worst opportunities, WalletHub compared states across 17 key metrics to identify the Best & Worst States for Working Moms.

Chip Lupo, WalletHub Analyst
Main Findings
Best and Worst States for Working Moms
|
Overall Rank |
State |
Total Score |
Child Care Rank |
Professional Opportunities Rank |
Work-Life Balance Rank |
|---|---|---|---|---|---|
| 1 | Connecticut | 70.28 | 1 | 2 | 8 |
| 2 | Massachusetts | 69.25 | 2 | 6 | 1 |
| 3 | Rhode Island | 63.69 | 5 | 14 | 3 |
| 4 | New Jersey | 59.26 | 10 | 5 | 7 |
| 5 | Vermont | 58.34 | 6 | 9 | 9 |
| 6 | Maine | 57.49 | 3 | 20 | 13 |
| 7 | Minnesota | 56.42 | 7 | 4 | 16 |
| 8 | District of Columbia | 56.27 | 16 | 10 | 6 |
| 9 | New York | 53.37 | 12 | 33 | 12 |
| 10 | North Dakota | 53.24 | 11 | 12 | 20 |
| 11 | Maryland | 52.97 | 15 | 1 | 44 |
| 12 | Illinois | 52.71 | 9 | 8 | 24 |
| 13 | Indiana | 51.68 | 4 | 27 | 28 |
| 14 | Wisconsin | 50.28 | 21 | 25 | 10 |
| 15 | Washington | 50.25 | 35 | 29 | 2 |
| 16 | New Hampshire | 50.02 | 8 | 22 | 34 |
| 17 | Tennessee | 48.30 | 13 | 7 | 49 |
| 18 | Delaware | 47.81 | 14 | 17 | 41 |
| 19 | Wyoming | 47.65 | 19 | 37 | 18 |
| 20 | South Dakota | 47.48 | 20 | 19 | 25 |
| 21 | Pennsylvania | 47.47 | 18 | 13 | 33 |
| 22 | Oregon | 46.79 | 44 | 23 | 4 |
| 23 | Nebraska | 46.71 | 22 | 15 | 26 |
| 24 | Utah | 46.54 | 24 | 41 | 11 |
| 25 | Kansas | 46.35 | 23 | 24 | 19 |
| 26 | Iowa | 46.12 | 30 | 3 | 21 |
| 27 | Ohio | 44.85 | 26 | 16 | 22 |
| 28 | Virginia | 44.79 | 17 | 30 | 42 |
| 29 | Colorado | 44.42 | 25 | 18 | 27 |
| 30 | California | 43.83 | 43 | 40 | 5 |
| 31 | Hawaii | 43.59 | 27 | 45 | 15 |
| 32 | Montana | 42.94 | 33 | 35 | 14 |
| 33 | Alaska | 39.19 | 34 | 39 | 23 |
| 34 | Kentucky | 38.77 | 28 | 44 | 38 |
| 35 | Arkansas | 38.60 | 37 | 32 | 31 |
| 36 | Michigan | 38.29 | 39 | 28 | 30 |
| 37 | North Carolina | 38.12 | 42 | 21 | 36 |
| 38 | Georgia | 38.00 | 31 | 11 | 51 |
| 39 | Oklahoma | 37.86 | 29 | 47 | 39 |
| 40 | Missouri | 37.29 | 38 | 34 | 37 |
| 41 | Florida | 36.61 | 36 | 26 | 47 |
| 42 | Idaho | 36.10 | 46 | 48 | 17 |
| 43 | Texas | 35.86 | 32 | 38 | 48 |
| 44 | West Virginia | 35.62 | 40 | 43 | 35 |
| 45 | South Carolina | 32.71 | 45 | 42 | 45 |
| 46 | Arizona | 32.08 | 49 | 36 | 29 |
| 47 | Nevada | 30.40 | 48 | 31 | 46 |
| 48 | Mississippi | 29.84 | 41 | 51 | 50 |
| 49 | New Mexico | 27.47 | 51 | 46 | 32 |
| 50 | Alabama | 27.39 | 47 | 49 | 43 |
| 51 | Louisiana | 26.39 | 50 | 50 | 40 |
Note: With the exception of “Total Score,” all of the columns in the table above depict the relative rank of that state, where a rank of 1 represents the best conditions for that metric category.

- Best
- 1. Massachusetts
- 2. New York
- T-3. Pennsylvania
- T-3. Rhode Island
- 5. North Dakota
- Worst
- 46. Arizona
- 47. Alabama
- 48. Florida
- 49. Idaho
- 50. Louisiana

- Lowest
- 1. South Dakota
- 2. Kansas
- 3. Mississippi
- 4. Idaho
- 5. South Carolina
- Highest
- 47. Oregon
- 48. California
- 49. Nebraska
- 50. Washington
- 51. New York

- Lowest
- 1. Maryland
- 2. Vermont
- 3. Illinois
- 4. Connecticut
- T-5. California
- T-5. Maine
- Highest
- 47. Idaho
- 48. Washington
- 49. Virginia
- 50. New Hampshire
- 51. Utah

- Highest
- 1. Iowa
- 2. District of Columbia
- 3. New Hampshire
- 4. South Dakota
- 5. Vermont
- Lowest
- 47. South Carolina
- 48. Idaho
- 49. Alabama
- 50. Mississippi
- 51. Utah
In-Depth Look at the Best Places for Working Moms
Connecticut
Connecticut ranks as the best place for working moms, and it had some of the lowest unemployment rates for women last year, at just 2.7%. In addition, Connecticut has a small gender pay gap, with women earning over 89% of what men make, the fourth-highest rate in the country highlighting the state's commitment to pay equity and economic opportunities for women.
Connecticut is great when it comes to childcare. It ranks among the top states when it comes to day care quality and the share of child care centers that are nationally accredited.
Finally, Connecticut has very good parental-leave policies and is among the best places in the country for working from home.
Massachusetts
Massachusetts is the second-best state for working moms, in part because it has one of the lowest shares of single moms with children under 18 living in poverty, indicating a strong economic environment for families. Women are also able to take a good amount of time off when they are ready to have a child, as Massachusetts has the best parental-leave policies in the country.
Working moms can benefit from a relatively short work week as well, as the average woman in Massachusetts works around 35.6 hours per week. The Bay State is one of the best states for working from home, too, which can allow moms to easily keep an eye on their kids while still performing their jobs.
Finally, the quality of education that children receive is another big concern for moms, and Massachusetts has the best public schools in the country.
Rhode Island
Rhode Island is the third-best state for working moms, and it has some of the lowest gender-representation gaps in the country when it comes to the manufacturing industry. The state also provides good opportunities for women to advance in the workplace, with one of the highest ratios of female to male executives and senior-level managers.
The Ocean State also has one of the shortest work weeks as the average woman works around 35.5 hours per week, and it scores very highly when it comes to parental leave policies, allowing women to take breaks from work when they have a child.
In addition, Rhode Island has some of the most pediatricians per capita, which helps children’s health care needs to be addressed in a timely manner. It also has a lot of childcare workers per capita, giving moms plenty of places to send their children during the day while they work.
Red States vs. Blue States

Ask the Experts
For added insight into how to address workplace gender inequality, especially for working mothers, we turned to a panel of experts. They range from university professors who research gender roles and economics to the authors of some of the most popular career and women’s blogs. Click on the experts’ profiles to read their bios and responses to the following key questions:
- What can companies do to help working parents balance their home and work life?
- What careers are the most difficult and the easiest for balancing work and family?
- In evaluating the best states for working moms, what are the top five indicators?
- What are some key drivers to attract, retain and support working parents?
- What steps should policymakers take to support working mothers’ labor force participation and address disparities between men and women in the labor market?
Ask the Experts

Ph.D., Professor - University of Wisconsin-Stout / Wisconsin's Polytechnic University
Read More

Professor of Law Emerita and Program Chair, Paralegal Studies – University of Richmond
Read More

Ph.D., Associate Professor, Department of Psychology - University of California, Riverside
Read More

Ph.D. – Assistant Professor, University of Nebraska–Lincoln; Child, Youth & Family Studies; Director, Nebraska Strong Families Lab; Coordinator, Human Development & Family Science; Associate Editor, Family Process
Read More

Professor Political Science (Government) Department, St. Lawrence University
Read More

Professor of Sociology, College of Arts and Sciences - The Ohio State University
Read More
Methodology
In order to determine the best and worst states for working moms, WalletHub compared the 50 states and the District of Columbia across three key dimensions: 1) Child Care, 2) Professional Opportunities and 3) Work-Life Balance.
We evaluated those dimensions using 17 relevant metrics, which are listed below with their corresponding weights. Each metric was graded on a 100-point scale, with a score of 100 representing the most favorable conditions for working moms.
We then determined each state and the District’s weighted average across all metrics to calculate its overall score and used the resulting scores to rank-order our sample.
Child Care – Total Points: 40
- Day-Care Quality: Double Weight (~10.00 Points)
- Child-Care Costs: Full Weight (~5.00 Points)
Note: This metric was adjusted for the median women’s salary. - Pediatricians per Capita: Full Weight (~5.00 Points)
- School-System Quality: Double Weight (~10.00 Points)
Note: This metric is based on WalletHub’s “States with the Best & Worst School Systems” ranking. - Share of Nationally Accredited Child Care Centers: Full Weight (~5.00 Points)
- Number of Childcare Workers per Total Number of Children: Full Weight (~5.00 Points)
Note: Childcare workers attend to the basic needs of children, such as dressing, bathing, feeding, and overseeing play. They may help younger children prepare for kindergarten or assist older children with homework.
Professional Opportunities – Total Points: 30
- Gender Pay Gap: Double Weight (~6.67 Points)
Note: This metric measures women’s earnings as a percentage of men’s. - Ratio of Female Executives to Male Executives: Full Weight (~3.33 Points)
- Median Women’s Salary: Full Weight (~3.33 Points)
Note: This metric was adjusted for the cost of living. - Share of Working Women Living with Economic Security: Full Weight (~3.33 Points)
Note: This metric is based on the Basic Economic Security Tables (BEST) Index, which measures how much income working adults of different family types need to be economically secure. Economic security means having “enough income to meet basic monthly expenses—such as housing, food, transportation and child care expenses—and save for emergencies and retirement.” - Share of Families in Poverty: Full Weight (~3.33 Points)
Note: “Families” include single mothers with children aged 0 to 17. - Female Unemployment Rate: Full Weight (~3.33 Points)
- Gender-Representation Gap in Different Economic Sectors: Full Weight (~3.33 Points)
Note: This metric measures the absolute difference between the share of female employees and male employees. - WalletHub “Best States for Working from Home” Ranking: Full Weight (~3.33 Points)
Note: This metric is based on WalletHub’s “Best States for Working from Home” ranking.
Work-Life Balance – Total Points: 30
- Parental-Leave Policy Score: Double Weight (~15.00 Points)
Note: This metric is based on the report card from Expecting Better: A State-by-State Analysis of Laws That Help Expecting and New Parents. - Average Length of a Woman’s Work Week (in Hours): Full Weight (~7.50 Points)
- Women’s Average Commute Time (in Minutes): Full Weight (~7.50 Points)
Sources: Data used to create this ranking were collected as of March 30, 2026 from the U.S. Census Bureau, Bureau of Labor Statistics, Child Care Aware® of America, Equal Employment Opportunity Commission, Council for Community and Economic Research, Institute for Women's Policy Research, National Partnership for Women & Families, Knee Regulatory Research Center and WalletHub research.


WalletHub's personal finance experts are frequently cited by leading media outlets. Contact our media team to arrange an interview.