

Tax Day can be a painful reminder of how much we have to invest in federal, state and local governments, though many of us aren’t sure exactly what we get in return. As a result, this creates a disconnect in the minds of taxpayers between the amount of money we need to fork over on Tax Day (April 15 this year) and how much we feel is warranted.
Around 66% of Americans think their current tax rate is too high, according to WalletHub’s Taxpayer Survey. We do know, however, that taxpayer return on investment, or ROI, varies based on where one lives. To determine the states with the best taxpayer ROI, WalletHub contrasted state and local tax collections with the quality of the services residents receive in each of the 50 states. Our data set includes a total of 29 key metrics.

Chip Lupo, WalletHub Analyst
Main Findings
State and Local Taxes Paid vs. Spending Received by State
| Taxpayer ROI Rank* | State | Total Taxes Paid per Capita Rank** | Overall Government Services Rank |
|---|---|---|---|
| 1 | New Hampshire | 1 | 1 |
| 2 | Florida | 2 | 23 |
| 3 | South Dakota | 6 | 18 |
| 4 | Missouri | 4 | 34 |
| 5 | Ohio | 9 | 25 |
| 6 | Georgia | 8 | 33 |
| 7 | Iowa | 23 | 11 |
| 8 | Indiana | 21 | 16 |
| 9 | Utah | 29 | 5 |
| 10 | Virginia | 30 | 4 |
| 11 | Colorado | 7 | 35 |
| 12 | Wisconsin | 28 | 6 |
| 13 | Texas | 5 | 43 |
| 14 | Arizona | 10 | 39 |
| 15 | Nebraska | 27 | 14 |
| 16 | Michigan | 18 | 28 |
| 17 | North Carolina | 16 | 31 |
| 18 | Pennsylvania | 24 | 20 |
| 19 | Rhode Island | 35 | 9 |
| 20 | Alabama | 12 | 38 |
| 21 | Wyoming | 34 | 13 |
| 22 | Maine | 32 | 15 |
| 23 | South Carolina | 13 | 41 |
| 24 | Kentucky | 19 | 32 |
| 25 | Tennessee | 14 | 40 |
| 26 | Alaska | 3 | 48 |
| 27 | Idaho | 31 | 19 |
| 28 | Oklahoma | 11 | 45 |
| 29 | West Virginia | 20 | 36 |
| 30 | Montana | 25 | 30 |
| 31 | Maryland | 38 | 17 |
| 32 | Mississippi | 17 | 44 |
| 33 | Kansas | 33 | 27 |
| 34 | Oregon | 22 | 42 |
| 35 | New Jersey | 40 | 12 |
| 36 | Washington | 37 | 26 |
| 37 | Minnesota | 44 | 2 |
| 38 | Massachusetts | 42 | 10 |
| 39 | Illinois | 39 | 22 |
| 40 | Connecticut | 43 | 8 |
| 41 | Louisiana | 15 | 49 |
| 42 | Vermont | 48 | 3 |
| 43 | Arkansas | 26 | 47 |
| 44 | Delaware | 45 | 21 |
| 45 | Nevada | 36 | 46 |
| 46 | New York | 41 | 29 |
| 47 | North Dakota | 50 | 7 |
| 48 | Hawaii | 49 | 24 |
| 49 | California | 47 | 37 |
| 50 | New Mexico | 46 | 50 |
Notes: *No. 1 = Best
**“Per Capita” includes the population aged 18 and older.
With the exception of “Taxpayer ROI,” all of the columns in the table above depict the relative rank of that state, where a rank of 1 represents the lowest total taxes paid per capita and the best government services, respectively.

- Best
- 1. Massachusetts
- 2. Connecticut
- 3. New Jersey
- 4. Virginia
- 5. New Hampshire
- Worst
- 46. Oregon
- 47. Arizona
- 48. Alaska
- 49. Oklahoma
- 50. New Mexico

- Best
- 1. Vermont
- 2. Georgia
- 3. Indiana
- 4. Tennessee
- 5. Kansas
- Worst
- 46. Maine
- 47. Iowa
- 48. West Virginia
- 49. Pennsylvania
- 50. Rhode Island

- Best
- 1. Utah
- 2. Rhode Island
- T-3. Kansas
- T-3. Vermont
- 5. Iowa
- Worst
- 45. New Mexico
- 46. California
- 47. Hawaii
- 48. New York
- 49. New Jersey

- Lowest
- 1. Maine
- 2. New Hampshire
- 3. Connecticut
- 4. Rhode Island
- 5. Wyoming
- Highest
- 46. Louisiana
- 47. Arkansas
- 48. Tennessee
- T-49. New Mexico
- T-49. Alaska

- Best
- 1. Hawaii
- 2. North Dakota
- 3. South Dakota
- 4. Delaware
- T-5. Massachusetts
- T-5. Missouri
- Worst
- 46. Texas
- 47. Nevada
- T-48. New Mexico
- T-48. Louisiana
- T-48. Oklahoma

- Lowest
- 1. New Hampshire
- 2. Utah
- 3. Minnesota
- T-4. Colorado
- T-4. Maryland
- Highest
- 46. Kentucky
- 47. West Virginia
- 48. New Mexico
- T-49. Louisiana
- T-49. Mississippi
In-Depth Look at the States With the Best Taxpayer ROI
New Hampshire
New Hampshire is the state with the best taxpayer return on investment, which is due in large part to the fact that it has no state income tax. Residents only pay property taxes, sales taxes and excise taxes to the state. The Granite State’s tax resources have had a good impact on crime prevention and the environment, as the state has the lowest crime rate and the third-lowest air pollution in the country. It has one of the best public school systems as well.
Aside from those areas, the quality of the rest of New Hampshire’s government services doesn’t stand out much. However, New Hampshire residents are still doing very well for themselves, considering they’re paying out less money in taxes, and the state has some of the lowest unemployment and poverty rates in the country.
Florida
Florida is the state with the second-best taxpayer ROI, largely because it does not charge its residents an income tax. One way its tax dollars are hard at work is on education, as Florida has the fifth-best public universities in the U.S., as well as second-highest projected increase in public high school graduation rates between the 2024–2025 and 2035–2036.
Florida’s infrastructure is pretty decent as well, with the third-best bridge quality and 11th-best road quality in the country. When it comes to most other services, Florida is toward the middle of the pack, but the lack of income taxes makes up for it. Florida has one of the lowest unemployment rates, too.
South Dakota
South Dakota has the third-best taxpayer ROI, and like the other top states, it does not charge its residents any income tax. The state also stands out when it comes to certain government services. For example, it has the fourth-highest spending on parks and recreation per capita, and the seventh-highest highway spending per driver. This highway spending has helped the state have the lowest average commute time in the country.
South Dakota also does pretty well when it comes to certain aspects of public health. It ranks fifth in the nation for air quality and seventh for residents’ access to fluoridated water.
To top things off, South Dakota has the lowest unemployment rate and underemployment rate, which results in more tax revenue as people spend more, and also shows that the state’s services provide a good environment to live in.
Blue States vs. Red States
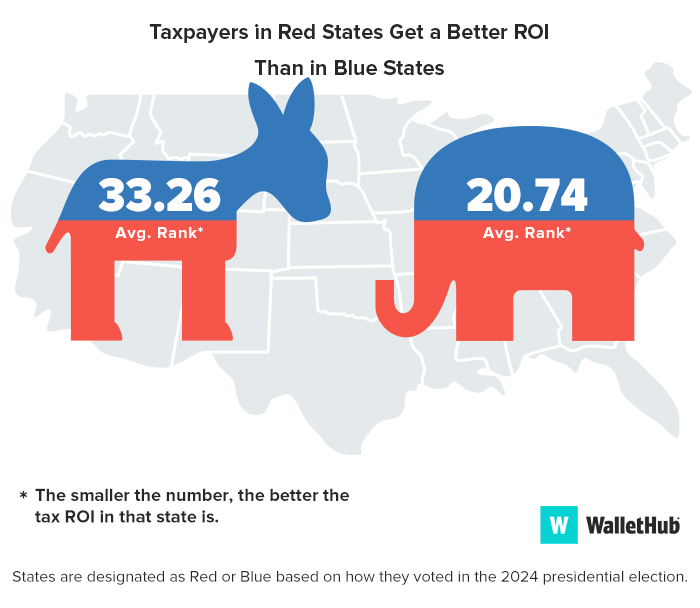
Detailed Breakdown by State
| Overall Gov’t. Services Rank | State | Total Score | Education Rank | Health Rank | Safety Rank | Economy Rank | Infrastructure & Pollution Rank |
|---|---|---|---|---|---|---|---|
| 1 | New Hampshire | 69.05 | 12 | 1 | 1 | 3 | 36 |
| 2 | Minnesota | 67.89 | 17 | 2 | 8 | 5 | 5 |
| 3 | Vermont | 65.70 | 10 | 8 | 11 | 23 | 4 |
| 4 | Virginia | 65.18 | 5 | 21 | 12 | 2 | 9 |
| 5 | Utah | 64.89 | 18 | 15 | 7 | 1 | 20 |
| 6 | Wisconsin | 64.34 | 1 | 11 | 9 | 13 | 26 |
| 7 | North Dakota | 63.95 | 25 | 6 | 18 | 33 | 1 |
| 8 | Connecticut | 63.57 | 3 | 18 | 4 | 25 | 25 |
| 9 | Rhode Island | 62.74 | 7 | 3 | 3 | 44 | 46 |
| 10 | Massachusetts | 62.43 | 11 | 4 | 6 | 29 | 39 |
| 11 | Iowa | 62.15 | 20 | 5 | 13 | 15 | 24 |
| 12 | New Jersey | 61.16 | 6 | 17 | 5 | 17 | 45 |
| 13 | Wyoming | 61.12 | 22 | 35 | 16 | 14 | 3 |
| 14 | Nebraska | 59.22 | 26 | 20 | 14 | 22 | 7 |
| 15 | Maine | 59.19 | 16 | 19 | 2 | 43 | 35 |
| 16 | Indiana | 59.06 | 4 | 23 | 19 | 36 | 15 |
| 17 | Maryland | 58.75 | 2 | 13 | 33 | 8 | 23 |
| 18 | South Dakota | 57.35 | 36 | 14 | 30 | 11 | 2 |
| 19 | Idaho | 57.27 | 43 | 12 | 10 | 12 | 13 |
| 20 | Pennsylvania | 57.10 | 21 | 10 | 17 | 26 | 31 |
| 21 | Delaware | 55.19 | 8 | 34 | 31 | 32 | 6 |
| 22 | Illinois | 54.13 | 19 | 24 | 25 | 27 | 34 |
| 23 | Florida | 53.59 | 13 | 38 | 23 | 19 | 37 |
| 24 | Hawaii | 52.43 | 48 | 9 | 15 | 41 | 18 |
| 25 | Ohio | 52.17 | 33 | 25 | 20 | 35 | 22 |
| 26 | Washington | 51.79 | 14 | 31 | 34 | 24 | 32 |
| 27 | Kansas | 51.34 | 28 | 16 | 35 | 28 | 11 |
| 28 | Michigan | 50.91 | 27 | 22 | 29 | 31 | 28 |
| 29 | New York | 50.69 | 15 | 32 | 26 | 42 | 41 |
| 30 | Montana | 50.66 | 29 | 29 | 36 | 18 | 12 |
| 31 | North Carolina | 49.98 | 24 | 43 | 32 | 16 | 17 |
| 32 | Kentucky | 49.82 | 30 | 37 | 21 | 49 | 8 |
| 33 | Georgia | 48.47 | 34 | 46 | 27 | 4 | 29 |
| 34 | Missouri | 47.88 | 31 | 26 | 39 | 10 | 42 |
| 35 | Colorado | 47.04 | 42 | 7 | 46 | 9 | 38 |
| 36 | West Virginia | 46.77 | 46 | 44 | 22 | 39 | 10 |
| 37 | California | 45.95 | 9 | 28 | 43 | 47 | 49 |
| 38 | Alabama | 45.34 | 37 | 48 | 28 | 20 | 27 |
| 39 | Arizona | 45.12 | 39 | 33 | 42 | 6 | 43 |
| 40 | Tennessee | 44.61 | 23 | 45 | 49 | 7 | 16 |
| 41 | South Carolina | 44.48 | 32 | 36 | 45 | 38 | 14 |
| 42 | Oregon | 44.42 | 40 | 27 | 38 | 40 | 33 |
| 43 | Texas | 43.05 | 38 | 42 | 37 | 21 | 44 |
| 44 | Mississippi | 42.47 | 47 | 49 | 24 | 30 | 47 |
| 45 | Oklahoma | 40.61 | 44 | 40 | 41 | 37 | 40 |
| 46 | Nevada | 40.58 | 41 | 30 | 40 | 48 | 50 |
| 47 | Arkansas | 39.32 | 35 | 47 | 48 | 34 | 21 |
| 48 | Alaska | 36.07 | 50 | 50 | 44 | 46 | 19 |
| 49 | Louisiana | 34.73 | 45 | 41 | 47 | 50 | 48 |
| 50 | New Mexico | 33.06 | 49 | 39 | 50 | 45 | 30 |
Note: With the exception of “Total Score,” all of the columns in the table above depict the relative rank of that state, where a rank of 1 represents the best conditions for that metric category.
Ask the Experts
For more insight into how taxpayer funds are turned into government services as well as how taxpayers can measure the efficiency with which their money is used, we turned to a panel of economics and public-policy experts. You can check out their bios and responses to the following questions below.
- Do states with high tax burdens provide better government services?
- How can state and local governments use tax revenue more efficiently?
- How can everyday citizens assess the ROI of their local tax dollars?
- What's the most common way local governments waste taxpayer dollars?
- What are the most efficient ways for local governments to mitigate the fiscal impact of inflation?
Ask the Experts

Ph.D. – Associate Professor, College of Business and Management - Lynn University
Read More

Ph.D. – Associate Professor, Department of Public Administration, E. J. Ourso College of Business - Louisiana State University
Read More

Senior Director of the Morey Fiscal Policy Initiative - Mackinac Center for Public Policy
Read More

Esq. LL.M. – Tax Attorney, Adjunct Professor, Master of Science in Taxation Program and Adjunct Professor, Politics, Law and Society – Bryant University
Read More

Director, Edward J. Collins, Jr. Center for Public Management - University of Massachusetts Boston
Read More

Professor of Law and Honors Professor – University of Alabama School of Law
Read More
Methodology
In order to determine which states yield the best and worst return on investment (ROI) for taxpayers, WalletHub compared the quality of government services received by residents to the total state and local taxes they pay in each of the 50 states.
First, we analyzed each state across five key government-service categories: 1) Education, 2) Health, 3) Safety, 4) Economy and 5) Infrastructure & Pollution. The categories were further broken down into 29 relevant metrics, which are listed below with their corresponding weights. Each metric was graded on a 100-point scale, with a score of 100 representing the best quality of government service.
We then determined each state’s weighted average across all 29 metrics to calculate its “Overall Government Services Score.”
Finally, we constructed the Taxpayer ROI ranking by comparing each state’s “Overall Government Services Score” to its “Total Taxes Paid per Capita.” “Per Capita” includes the population aged 18 and older.
Education – Total Points: 20
- Quality of Public University System: Double Weight (~5.71 Points)
Note: Based on data from WalletHub’s “College & University Rankings.” - Quality of School System: Double Weight (~5.71 Points)
Note: Based on data from WalletHub’s “States with the Best & Worst School Systems” ranking. - Public High-School Graduation Rate: Half Weight (~1.43 Points)
- Projected Public High School Graduation Rate Increase Between 2024-2025 and 2035-2036: Half Weight (~1.43 Points)
- Share of Idle Youth: Half Weight (~1.43 Points)
Note: This metric refers to people ages 18-24 not attending school, not working, and with no degree beyond high school. - States with School Programs: Half Weight (~1.43 Points)
Note: This binary metric measures the presence or absence of school programs.
Programs include education savings accounts, school vouchers or tax-credit scholarship programs.
- Presence of Free Community College Education: Half Weight (~1.43 Points)
- State Pre-K Funding per Preschool- Enrolled Children: Half Weight (~1.43 Points)
Health – Total Points: 20
- Hospital Beds per 1,000 Residents: Full Weight (~2.50 Points)
- Quality of Public Hospitals: Double Weight (~5.00 Points)
Note: Based on data from Centers for Medicare & Medicaid Services. - Average Life Expectancy at Birth (in years): Full Weight (~2.50 Points)
- Infant-Mortality Rate per 1,000 Live Births: Full Weight (~2.50 Points)
- Average Health-Insurance Premium: Full Weight (~2.50 Points)
- Quality of Health Care: Double Weight (~5.00 Points)
Note: Based on data from WalletHub’s “States with the Best & Worst Health Care” ranking.
Safety – Total Points: 20
- Violent-Crime Rate per Capita: Double Weight (~10.00 Points)
- Property-Crime Rate per Capita: Full Weight (~5.00 Points)
- Fatalities per 100 Million Vehicle Miles Traveled: Full Weight (~5.00 Points)
Economy – Total Points: 20
- Median Annual Household Income: Double Weight (~5.71 Points)
Note: Adjusted for cost of living. - Annual Job-Growth Rate: Full Weight (~2.86 Points)
Note: Adjusted for population growth. - Share of Residents Living in Poverty: Full Weight (~2.86 Points)
- Unemployment Rate: Double Weight (~5.71 Points)
- Underemployment Rate: Full Weight (~2.86 Points)
Infrastructure & Pollution – Total Points: 20
- Quality of Roads & Bridges: Double Weight (~5.00 Points)
- Average Commute Time (in minutes): Full Weight (~2.50 Points)
- Parks & Recreation Expenses per Capita: Full Weight (~2.50 Points)
- State Highway Spending per Driver: Full Weight (~2.50 Points)
- Water Quality: Full Weight (~2.50 Points)
- Share of Population Who Receive Fluoridated Water Through CWSs (Community Water Systems): Full Weight (~2.50 Points)
- Air Pollution: Full Weight (~2.50 Points)
Sources: Data used to create this ranking were collected as of February 24, 2026 from the U.S. Census Bureau, Bureau of Labor Statistics, National Center for Education Statistics, Western Interstate Commission for Higher Education, The Annie E. Casey Foundation, The Campaign for Free College Tuition, National Institute for Early Education Research, Kaiser Family Foundation, National Highway Traffic Safety Administration, Centers for Medicare & Medicaid Services, County Health Rankings, Centers for Disease Control and Prevention, Federal Highway Administration, United Health Foundation, Council for Community and Economic Research, Road Information Program, Federal Bureau of Investigation, EdChoice, Health Resources and Services Administration, and WalletHub research.


WalletHub's personal finance experts are frequently cited by leading media outlets. Contact our media team to arrange an interview.