
Doctors play one of the most vital roles in society and are compensated accordingly for the demanding work they do to keep patients healthy. They rank among the highest-paid and most highly educated professionals in the United States, with family medicine physicians earning a median annual salary of about $238,000. This level of pay reflects the life-saving nature of their work and the many challenges that come with a medical career. Still, most doctors do not begin their careers financially secure, as the average medical school graduate carries roughly $247,000 in student debt.
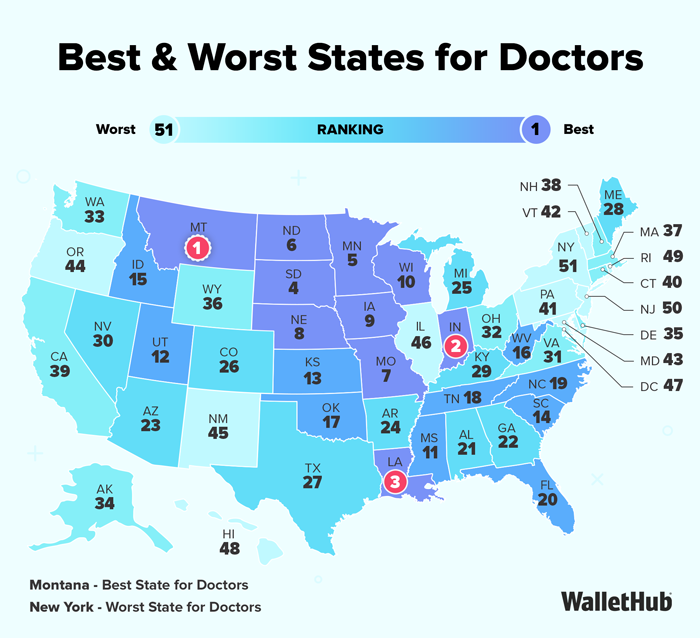
Given the high cost of medical training and the difficulty of the profession, it is important for doctors to practice in states that offer strong financial opportunities along with favorable working conditions. To assist doctors in choosing where to practice, WalletHub compared all 50 states and the District of Columbia using 19 key metrics. These factors range from physicians’ average annual wages to hospitals per capita and the quality of each state’s public hospital system.

Chip Lupo, WalletHub Analyst
Main Findings
Best States to Practice Medicine
| Overall Rank | State | Total Score | Opportunity & Competition Rank | Medical Environment Rank |
|---|---|---|---|---|
| 1 | Montana | 66.15 | 2 | 15 |
| 2 | Indiana | 64.47 | 7 | 8 |
| 3 | Louisiana | 63.94 | 3 | 26 |
| 4 | South Dakota | 63.20 | 4 | 27 |
| 5 | Minnesota | 63.01 | 13 | 7 |
| 6 | North Dakota | 62.91 | 10 | 14 |
| 7 | Missouri | 62.65 | 1 | 42 |
| 8 | Nebraska | 62.37 | 24 | 3 |
| 9 | Iowa | 62.28 | 6 | 30 |
| 10 | Wisconsin | 61.43 | 14 | 18 |
| 11 | Mississippi | 61.41 | 8 | 32 |
| 12 | Utah | 61.23 | 31 | 1 |
| 13 | Kansas | 61.19 | 15 | 19 |
| 14 | South Carolina | 61.11 | 20 | 6 |
| 15 | Idaho | 60.93 | 5 | 43 |
| 16 | West Virginia | 60.31 | 9 | 37 |
| 17 | Oklahoma | 60.22 | 21 | 9 |
| 18 | Tennessee | 60.16 | 19 | 12 |
| 19 | North Carolina | 59.64 | 29 | 4 |
| 20 | Florida | 59.30 | 16 | 35 |
| 21 | Alabama | 58.99 | 11 | 41 |
| 22 | Georgia | 58.98 | 18 | 31 |
| 23 | Arizona | 57.96 | 17 | 40 |
| 24 | Arkansas | 57.65 | 22 | 28 |
| 25 | Michigan | 57.26 | 23 | 29 |
| 26 | Colorado | 57.25 | 26 | 20 |
| 27 | Texas | 57.23 | 30 | 11 |
| 28 | Maine | 56.98 | 34 | 5 |
| 29 | Kentucky | 56.66 | 12 | 50 |
| 30 | Nevada | 54.53 | 33 | 22 |
| 31 | Virginia | 54.05 | 37 | 13 |
| 32 | Ohio | 53.98 | 28 | 44 |
| 33 | Washington | 53.94 | 27 | 45 |
| 34 | Alaska | 53.91 | 47 | 2 |
| 35 | Delaware | 53.07 | 38 | 17 |
| 36 | Wyoming | 52.76 | 25 | 48 |
| 37 | Massachusetts | 52.67 | 35 | 34 |
| 38 | New Hampshire | 52.59 | 36 | 25 |
| 39 | California | 52.25 | 42 | 16 |
| 40 | Connecticut | 51.33 | 46 | 10 |
| 41 | Pennsylvania | 51.10 | 41 | 33 |
| 42 | Vermont | 50.79 | 44 | 23 |
| 43 | Maryland | 50.55 | 39 | 39 |
| 44 | Oregon | 49.37 | 43 | 36 |
| 45 | New Mexico | 48.89 | 40 | 46 |
| 46 | Illinois | 48.83 | 32 | 51 |
| 47 | District of Columbia | 46.59 | 49 | 21 |
| 48 | Hawaii | 45.98 | 45 | 49 |
| 49 | Rhode Island | 45.86 | 50 | 24 |
| 50 | New Jersey | 44.03 | 51 | 38 |
| 51 | New York | 43.89 | 48 | 47 |
Note: With the exception of “Total Score,” all of the columns in the table above depict the relative rank of that state, where a rank of 1 represents the best conditions for that metric category.

- Highest
- 1. Wisconsin
- 2. Missouri
- 3. Indiana
- 4. Iowa
- 5. Georgia
- Lowest
- 47. Massachusetts
- 48. Connecticut
- 49. New Jersey
- 50. Hawaii
- 51. District of Columbia

- Lowest
- 1. Mississippi
- 2. Missouri
- 3. Louisiana
- 4. Nevada
- 5. Alabama
- Highest
- 47. Nebraska
- 48. North Dakota
- T-49. New York
- T-49. Rhode Island
- T-49. District of Columbia

- Least
- 1. Indiana
- 2. Georgia
- 3. Delaware
- 4. South Carolina
- 5. Hawaii
- Most
- 47. Illinois
- 48. North Dakota
- 49. Wisconsin
- 50. Michigan
- 51. Ohio

- Lowest
- 1. North Dakota
- 2. Wyoming
- 3. Minnesota
- 4. North Carolina
- 5. Alaska
- Highest
- T-45. New York
- T-45. New Jersey
- T-45. Pennsylvania
- T-45. District of Columbia
- T-45. New Mexico

- Least Expensive
- 1. Nebraska
- 2. Wisconsin
- 3. Minnesota
- 4. Kansas
- 5. Idaho
- Most Expensive
- 46. Louisiana
- T-47. Washington
- T-47. District of Columbia
- 49. Illinois
- 50. New York
In-Depth Look at the Best States for Doctors
Montana
Montana is the best state for doctors, and it boasts one of the top hospital systems in the country. About 78% of patients in Montana gave their hospital a score of 9 or 10 on a scale of 0 to 10. Montana doctors are also well compensated. For example, the state has the second-highest average income for anesthesiologists, at nearly $442,000, in addition to high yearly incomes for psychiatrists and surgeons, who earn above $263,000 and almost $400,000 on average, respectively.
The Treasure State is also good on doctors’ mental well-being, as it has the lowest physician burnout rate. That bodes well for medical residents who train in Montana, as nearly 63% of them end up staying in-state, the second-highest retention rate in the country. Additionally, Montana enjoys both a high number of hospitals per 100,000 residents and physicians per 1,000 residents.
Indiana
Indiana is the second-best state for doctors, and one contributing factor is the high starting salaries for a wide range of practices, including psychiatrists ($343,000); physicians ($317,000); anesthesiologists ($396,000); and surgeons ($464,000). The state also gets highest marks for the punitiveness of its state medical board.
The Hoosier State also enjoys a high retention rate of medical residents who train in-state and some of the lowest malpractice insurance rates in the country. Plus, Indiana has well-ranked public hospital systems and a fairly low physician burnout rate.
Louisiana
Louisiana ranks as the third-best state for doctors, in part because it has one of the highest number of physicians per 1,000 residents in the country. The state ranks particularly high when it comes to the yearly salaries for obstetricians and gynecologists ($353,000), surgeons ($560,000) and pediatricians ($364,000).
In addition, the Pelican State has around 12.4 hospitals for every 100,000 residents, which is sixth-highest nationally and the state also receives high marks for the punitiveness of its state medical board. Louisiana also ranks well in projected physician supply, with the third-highest number expected by 2032.
Ask the Experts
Medicine is changing rapidly, and the way it is taught and practiced has to change too. The industry faces an aging population, new regulations and technological breakthroughs. With that in mind, we asked a panel of experts the following key questions:
- How does state and local policies influence the lives of doctors and other medical professionals?
- What tips can you offer current medical students about which specialties to pursue and where to practice?
- To what extent does the threat of a malpractice lawsuit affect a doctors’ ability to do their job?
- In evaluating the best states for doctors, what are the top five indicators?
- What are the biggest issues facing doctors today?
Ask the Experts

Assistant Professor, Political Science – The University of Alabama
Read More

Ph.D. - Assistant Professor, Department of Health Policy and Management, School of Public Health - Texas A&M University
Read More

MD, MBA – Professor of Health Policy and Management, City University of New York (CUNY) School of Public Health
Read More

Professor Emeritus; Co-Director of the Center for the Small City; Eugene Katz Letters and Science Distinguished Faculty Member – University of Wisconsin-Stevens Point
Read More

DNP, MPH, RN, NEA-BC – Assistant Professor, School of Nursing Graduate Division, Department of Health Administration and Leadership, Masters of Science in Health Administration, Doctorate of Nursing Practice – Azusa Pacific University
Read More

Ph.D. – Associate Professor and Department Chair, Department of Health Sciences – Providence College
Read More
Methodology
In order to identify the best states for doctors, WalletHub compared the 50 states and the District of Columbia across two key dimensions, “Opportunity & Competition” and “Medical Environment.”
We evaluated those dimensions using 19 relevant metrics, which are listed below with their corresponding weights. Each metric was graded on a 100-point scale, with a score of 100 representing the most favorable conditions for practicing doctors.
We then determined each state and the District’s weighted average across all metrics to calculate its overall score and used the resulting scores to rank-order the states.
Opportunity & Competition – Total Points: 70
- Physicians’ Average Annual Wage: Double Weight (~11.67 Points)
Note: Data for this metric were adjusted for the cost of living. - Physicians’ Average Monthly Starting Salary: Full Weight (~5.83 Points)
Note: Data for this metric were adjusted for the cost of living. - Hospitals per Capita: Full Weight (~5.83 Points)
- Insured Population Rate: Full Weight (~5.83 Points)
Note: “Population” includes noninstitutionalized civilians aged 16 and older. - Employer-Based Insurance Rate: Full Weight (~5.83 Points)
- Projected Share of Elderly Population: Full Weight (~5.83 Points)
Note: This metric measures the projected percentage of the population aged 65 and older by 2030. - Current Competition: Full Weight (~5.83 Points)
Note: This metric measures both the number of physicians per 1,000 Residents and the percentage of the population living in a primary-care HPSA, or Health Professional Shortage Area. HPSAs, as defined by the Health Resources & Services Administration, “are designations that indicate health care provider shortages in: Primary care; Dental health; or Mental Health” and “may be geographic-, population-, or facility-based.” - Share of Medical Residents Retained: Full Weight (~5.83 Points)
Note: The metric measures the net number of medical residents being added to the physician workforce of each state. - Projected Competition: Full Weight (~5.83 Points)
Note: This metric measures the projected number of physicians per 1,000 Residents by 2032. - Number of CME Credits Required: Full Weight (~5.83 Points)
Note: “CME” stands for Continuing Medical Education, credits for which the state may require medical professionals to earn in order to maintain their licenses. - Presence of Interstate Medical Licensure Compact Law: Full Weight (~5.83 Points)
Note: This metric is based on data from the Interstate Medical Licensure Compact and considers whether compact legislation has been enacted, introduced or not been introduced.
Medical Environment – Total Points: 30
- Quality of Public Hospital System: Full Weight (~3.75 Points)
Note: This metric is based on data from the Centers for Medicare & Medicaid Services. - Hospitals Safety - Percentage of “A” Hospitals: Full Weight (~3.75 Points)
Note: This metric is based on data from Leapfrog Hospital Safety Grade which ranked hospitals across the states based on 22 measures of publicly available hospital safety data. - Presence of Nationally Accredited Health Departments: Full Weight (~3.75 Points)
Note: This binary metric measures the presence or absence of national accredited health departments in a state. - Physician Assistants per Capita: Full Weight (~3.75 Points)
- Punitiveness of State Medical Board: Full Weight (~3.75 Points)
Note: This metric measures the number of serious disciplinary actions (per 1,000 physicians) taken by the state medical board. - Malpractice Award Payout Amount per Capita: Full Weight (~3.75 Points)
- Annual Malpractice Liability Insurance Rate: Full Weight (~3.75 Points)
- Physician Burnout: Full Weight (~3.75 Points)
Note: Physician burnout is defined as “a feeling of physical, emotional, or mental exhaustion, as well as frustration and cynicism related to work; and doubts about your competence and the value of your work.”
Sources: Data used to create this ranking were collected as of February 17, 2026 from the U.S. Census Bureau, Bureau of Labor Statistics, Council for Community and Economic Research, Health Resources & Services Administration, Association of American Medical Colleges, Projections Central’s State Occupational Projections, Federation of State Medical Boards, Leapfrog Group, Public Health Accreditation Board, Interstate Medical Licensure Compact, Arthur J. Gallagher & Co., Centers for Medicare & Medicaid Services, WebMD, Public Citizen and MEDPLI Insurance Services.


WalletHub's personal finance experts are frequently cited by leading media outlets. Contact our media team to arrange an interview.