Americans are carrying over $1.3 trillion in credit card debt as of Q3 2025 a staggering figure that continues to climb. The average U.S. household now owes more than $11,000 in credit card debt, marking a 0.5% decrease from the previous year.
However, credit card debt isn’t impacting everyone equally. To find out where Americans are managing their debt more or less sustainably, WalletHub analyzed TransUnion credit data to estimate the cost and time needed to pay off median credit card balances across more than 180 U.S. cities.

Chip Lupo, WalletHub Analyst
Main Findings
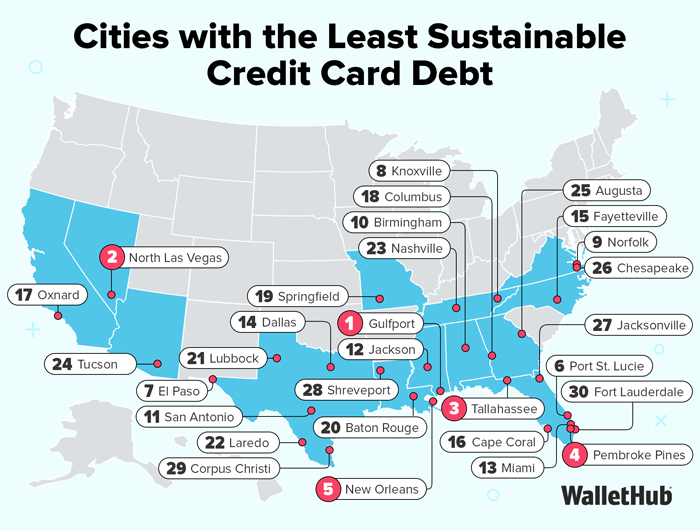
Cities with the Least Sustainable Credit Card Debt
| Overall Rank* | City | Median Credit Card Debt | Cost to Pay Off | Payoff Time (Income Adjusted) |
|---|---|---|---|---|
| 1 | Gulfport, MS | $2,997 | $3,532 | 105 months and 9 days |
| 2 | North Las Vegas, NV | $3,271 | $3,618 | 99 months and 26 days |
| 3 | Tallahassee, FL | $3,252 | $3,380 | 94 months and 23 days |
| 4 | Pembroke Pines, FL | $3,855 | $4,007 | 94 months and 22 days |
| 5 | New Orleans, LA | $3,759 | $3,898 | 94 months and 16 days |
| 6 | Port St. Lucie, FL | $3,378 | $3,473 | 93 months and 26 days |
| 7 | El Paso, TX | $3,000 | $3,061 | 93 months and 8 days |
| 8 | Knoxville, TN | $3,090 | $3,147 | 93 months and 3 days |
| 9 | Norfolk, VA | $3,360 | $3,154 | 86 months and 26 days |
| 10 | Birmingham, AL | $2,974 | $2,723 | 85 months and 1 day |
| 11 | San Antonio, TX | $3,150 | $2,881 | 84 months and 29 days |
| 12 | Jackson, MS | $2,588 | $2,298 | 82 months and 25 days |
| 13 | Miami, FL | $2,966 | $2,596 | 81 months and 24 days |
| 14 | Dallas, TX | $3,435 | $2,982 | 81 months and 7 days |
| 15 | Fayetteville, NC | $2,856 | $2,451 | 80 months and 12 days |
| 16 | Cape Coral, FL | $3,237 | $2,758 | 79 months and 28 days |
| 17 | Oxnard, CA | $2,889 | $2,370 | 77 months and 10 days |
| 18 | Columbus, GA | $2,815 | $2,249 | 75 months and 18 days |
| 19 | Springfield, MO | $2,555 | $2,027 | 75 months and 3 days |
| 20 | Baton Rouge, LA | $3,007 | $2,368 | 74 months and 20 days |
| 21 | Lubbock, TX | $2,999 | $2,348 | 74 months and 8 days |
| 22 | Laredo, TX | $2,580 | $2,016 | 74 months and 4 days |
| 23 | Nashville, TN | $3,577 | $2,790 | 74 months and 1 day |
| 24 | Tucson, AZ | $2,827 | $2,201 | 73 months and 29 days |
| 25 | Augusta, GA | $2,650 | $2,046 | 73 months and 12 days |
| 26 | Chesapeake, VA | $3,796 | $2,907 | 72 months and 26 days |
| 27 | Jacksonville, FL | $3,126 | $2,378 | 72 months and 13 days |
| 28 | Shreveport, LA | $2,838 | $2,158 | 72 months and 12 days |
| 29 | Corpus Christi, TX | $2,995 | $2,265 | 72 months and 2 days |
| 30 | Fort Lauderdale, FL | $3,607 | $2,721 | 71 months and 28 days |
| 31 | Missoula, MT | $2,994 | $2,195 | 70 months and 4 days |
| 32 | Memphis, TN | $2,706 | $1,974 | 69 months and 26 days |
| 33 | Virginia Beach, VA | $3,623 | $2,626 | 69 months and 13 days |
| 34 | Little Rock, AR | $3,211 | $2,313 | 69 months and 2 days |
| 35 | Reno, NV | $3,249 | $2,336 | 68 months and 29 days |
| 36 | Greensboro, NC | $2,845 | $2,040 | 68 months and 24 days |
| 37 | St. Petersburg, FL | $3,319 | $2,371 | 68 months and 17 days |
| 38 | Las Vegas, NV | $3,036 | $2,104 | 66 months and 23 days |
| 39 | New York, NY | $4,043 | $2,775 | 66 months and 6 days |
| 40 | Fontana, CA | $3,100 | $2,127 | 66 months and 5 days |
| 41 | Brownsville, TX | $2,314 | $1,585 | 66 months and 2 days |
| 42 | San Bernardino, CA | $2,546 | $1,740 | 65 months and 28 days |
| 43 | Chula Vista, CA | $3,559 | $2,423 | 65 months and 22 days |
| 44 | Tulsa, OK | $2,807 | $1,900 | 65 months and 11 days |
| 45 | Mobile, AL | $2,650 | $1,792 | 65 months and 10 days |
| 46 | Nampa, ID | $2,683 | $1,806 | 65 months and 2 days |
| 47 | Riverside, CA | $3,069 | $2,060 | 64 months and 28 days |
| 48 | Anchorage, AK | $3,889 | $2,563 | 63 months and 27 days |
| 49 | Hialeah, FL | $2,231 | $1,467 | 63 months and 23 days |
| 50 | Columbia, SC | $2,931 | $1,888 | 62 months and 18 days |
| 51 | Moreno Valley, CA | $2,777 | $1,787 | 62 months and 16 days |
| 52 | Henderson, NV | $3,722 | $2,387 | 62 months and 10 days |
| 53 | Ontario, CA | $2,886 | $1,850 | 62 months and 9 days |
| 54 | Rapid City, SD | $2,809 | $1,800 | 62 months and 9 days |
| 55 | Las Cruces, NM | $2,803 | $1,789 | 62 months and 1 day |
| 56 | Charleston, SC | $3,595 | $2,288 | 61 months and 28 days |
| 57 | Glendale, AZ | $2,793 | $1,769 | 61 months and 20 days |
| 58 | Houston, TX | $2,942 | $1,861 | 61 months and 17 days |
| 59 | Santa Ana, CA | $2,480 | $1,557 | 61 months and 5 days |
| 60 | Garland, TX | $2,555 | $1,604 | 61 months and 5 days |
| 61 | St. Louis, MO | $3,033 | $1,890 | 60 months and 24 days |
| 62 | Richmond, VA | $3,069 | $1,911 | 60 months and 22 days |
| 63 | Colorado Springs, CO | $3,216 | $2,000 | 60 months and 20 days |
| 64 | Phoenix, AZ | $2,950 | $1,829 | 60 months and 15 days |
| 65 | Scottsdale, AZ | $4,627 | $2,865 | 60 months and 13 days |
| 66 | Orlando, FL | $2,854 | $1,744 | 59 months and 22 days |
| 67 | Charlotte, NC | $3,247 | $1,967 | 59 months and 8 days |
| 68 | Amarillo, TX | $2,716 | $1,628 | 58 months and 21 days |
| 69 | Winston-Salem, NC | $2,604 | $1,559 | 58 months and 19 days |
| 70 | Los Angeles, CA | $3,186 | $1,901 | 58 months and 14 days |
| 71 | Montgomery, AL | $2,562 | $1,528 | 58 months and 13 days |
| 72 | Arlington, TX | $2,778 | $1,653 | 58 months and 9 days |
| 73 | Spokane, WA | $2,997 | $1,782 | 58 months and 9 days |
| 74 | Santa Clarita, CA | $4,379 | $2,597 | 58 months and 4 days |
| 75 | Long Beach, CA | $3,209 | $1,900 | 58 months and 2 days |
| 76 | Chattanooga, TN | $2,662 | $1,577 | 58 months and 2 days |
| 77 | Cincinnati, OH | $2,946 | $1,735 | 57 months and 24 days |
| 78 | Peoria, AZ | $3,454 | $2,033 | 57 months and 23 days |
| 79 | Mesa, AZ | $2,933 | $1,714 | 57 months and 11 days |
| 80 | Atlanta, GA | $4,158 | $2,423 | 57 months and 7 days |
| 81 | Juneau, AK | $3,542 | $2,061 | 57 months and 5 days |
| 82 | Fresno, CA | $2,742 | $1,591 | 57 months |
| 83 | Rochester, NY | $2,555 | $1,475 | 56 months and 23 days |
| 84 | Bakersfield, CA | $2,942 | $1,688 | 56 months and 14 days |
| 85 | Wichita, KS | $2,619 | $1,503 | 56 months and 14 days |
| 86 | Grand Prairie, TX | $2,869 | $1,646 | 56 months and 13 days |
| 87 | Newport News, VA | $2,746 | $1,558 | 55 months and 27 days |
| 88 | Aurora, CO | $3,029 | $1,715 | 55 months and 25 days |
| 89 | Wilmington, DE | $2,986 | $1,685 | 55 months and 18 days |
| 90 | Austin, TX | $3,697 | $2,085 | 55 months and 18 days |
| 91 | Raleigh, NC | $3,302 | $1,859 | 55 months and 15 days |
| 92 | Fort Smith, AR | $2,263 | $1,264 | 55 months and 3 days |
| 93 | Tampa, FL | $3,106 | $1,729 | 54 months and 29 days |
| 94 | Kansas City, MO | $2,889 | $1,603 | 54 months and 24 days |
| 95 | Oceanside, CA | $3,205 | $1,777 | 54 months and 23 days |
| 96 | Akron, OH | $2,426 | $1,341 | 54 months and 18 days |
| 97 | Stockton, CA | $2,740 | $1,512 | 54 months and 16 days |
| 98 | Albuquerque, NM | $2,842 | $1,565 | 54 months and 12 days |
| 99 | Huntington, WV | $2,374 | $1,295 | 53 months and 29 days |
| 100 | Fort Worth, TX | $2,888 | $1,566 | 53 months and 20 days |
| 101 | Detroit, MI | $2,255 | $1,216 | 53 months and 12 days |
| 102 | Anaheim, CA | $2,738 | $1,474 | 53 months and 9 days |
| 103 | Vancouver, WA | $2,978 | $1,601 | 53 months and 8 days |
| 104 | Billings, MT | $2,858 | $1,520 | 52 months and 23 days |
| 105 | Dover, DE | $2,425 | $1,272 | 52 months and 2 days |
| 106 | Sioux Falls, SD | $2,763 | $1,444 | 51 months and 29 days |
| 107 | Casper, WY | $2,890 | $1,503 | 51 months and 21 days |
| 108 | Lexington-Fayette, KY | $2,820 | $1,465 | 51 months and 19 days |
| 109 | Cheyenne, WY | $2,850 | $1,477 | 51 months and 16 days |
| 110 | Oklahoma City, OK | $2,530 | $1,299 | 51 months and 1 day |
| 111 | Denver, CO | $3,602 | $1,840 | 50 months and 26 days |
| 112 | Cleveland, OH | $2,288 | $1,168 | 50 months and 25 days |
| 113 | Gilbert, AZ | $3,869 | $1,975 | 50 months and 25 days |
| 114 | Providence, RI | $2,614 | $1,325 | 50 months and 15 days |
| 115 | Pearl City, HI | $3,083 | $1,534 | 49 months and 20 days |
| 116 | Salem, OR | $2,750 | $1,367 | 49 months and 18 days |
| 117 | Salt Lake City, UT | $2,882 | $1,432 | 49 months and 18 days |
| 118 | Fort Wayne, IN | $2,385 | $1,185 | 49 months and 18 days |
| 119 | Rancho Cucamonga, CA | $3,561 | $1,756 | 49 months and 7 days |
| 120 | Honolulu, HI | $2,967 | $1,463 | 49 months and 7 days |
| 121 | Chandler, AZ | $3,419 | $1,675 | 48 months and 30 days |
| 122 | Huntsville, AL | $2,851 | $1,390 | 48 months and 22 days |
| 123 | Newark, NJ | $2,122 | $1,029 | 48 months and 14 days |
| 124 | Tacoma, WA | $3,091 | $1,490 | 48 months and 7 days |
| 125 | Tempe, AZ | $2,657 | $1,271 | 47 months and 27 days |
| 126 | Charleston, WV | $2,656 | $1,269 | 47 months and 27 days |
| 127 | Boise, ID | $2,846 | $1,357 | 47 months and 23 days |
| 128 | Baltimore, MD | $2,832 | $1,340 | 47 months and 12 days |
| 129 | Buffalo, NY | $2,381 | $1,126 | 47 months and 12 days |
| 130 | Durham, NC | $2,990 | $1,412 | 47 months and 10 days |
| 131 | Santa Rosa, CA | $3,148 | $1,485 | 47 months and 8 days |
| 132 | Toledo, OH | $2,180 | $1,024 | 47 months and 3 days |
| 133 | Pittsburgh, PA | $2,816 | $1,318 | 46 months and 30 days |
| 134 | Portland, ME | $2,847 | $1,332 | 46 months and 29 days |
| 135 | Indianapolis, IN | $2,462 | $1,151 | 46 months and 28 days |
| 136 | Milwaukee, WI | $2,285 | $1,056 | 46 months and 12 days |
| 137 | Louisville, KY | $2,496 | $1,145 | 46 months and 3 days |
| 138 | Columbus, OH | $2,543 | $1,153 | 45 months and 19 days |
| 139 | Bridgeport, CT | $2,320 | $1,050 | 45 months and 16 days |
| 140 | Omaha, NE | $2,663 | $1,204 | 45 months and 15 days |
| 141 | Manchester, NH | $2,625 | $1,182 | 45 months and 10 days |
| 142 | Modesto, CA | $2,717 | $1,223 | 45 months and 9 days |
| 143 | Des Moines, IA | $2,360 | $1,051 | 44 months and 27 days |
| 144 | Fargo, ND | $2,450 | $1,089 | 44 months and 24 days |
| 145 | Overland Park, KS | $3,467 | $1,537 | 44 months and 21 days |
| 146 | Rutland, VT | $2,255 | $996 | 44 months and 16 days |
| 147 | Glendale, CA | $3,117 | $1,375 | 44 months and 15 days |
| 148 | Bismarck, ND | $2,772 | $1,219 | 44 months and 11 days |
| 149 | St. Paul, MN | $2,708 | $1,189 | 44 months and 9 days |
| 150 | Lincoln, NE | $2,431 | $1,068 | 44 months and 9 days |
| 151 | West Valley City, UT | $2,178 | $952 | 44 months and 3 days |
| 152 | Plano, TX | $3,483 | $1,511 | 43 months and 24 days |
| 153 | Grand Rapids, MI | $2,408 | $1,041 | 43 months and 20 days |
| 154 | Portland, OR | $3,229 | $1,395 | 43 months and 19 days |
| 155 | Chicago, IL | $2,979 | $1,282 | 43 months and 15 days |
| 156 | Sacramento, CA | $2,763 | $1,187 | 43 months and 12 days |
| 157 | Aurora, IL | $2,541 | $1,085 | 43 months and 5 days |
| 158 | San Diego, CA | $3,315 | $1,406 | 42 months and 28 days |
| 159 | Warwick, RI | $2,925 | $1,223 | 42 months and 10 days |
| 160 | Philadelphia, PA | $2,546 | $1,050 | 41 months and 25 days |
| 161 | Irving, TX | $2,456 | $994 | 41 months and 2 days |
| 162 | Oakland, CA | $3,306 | $1,321 | 40 months and 18 days |
| 163 | Yonkers, NY | $2,934 | $1,158 | 40 months and 3 days |
| 164 | Lewiston, ME | $2,058 | $804 | 39 months and 23 days |
| 165 | Garden Grove, CA | $2,216 | $858 | 39 months and 12 days |
| 166 | Boston, MA | $3,314 | $1,277 | 39 months and 7 days |
| 167 | Huntington Beach, CA | $3,622 | $1,394 | 39 months and 6 days |
| 168 | Burlington, VT | $2,541 | $941 | 37 months and 26 days |
| 169 | Minneapolis, MN | $2,837 | $1,047 | 37 months and 21 days |
| 170 | New Haven, CT | $2,199 | $793 | 36 months and 29 days |
| 171 | Nashua, NH | $2,741 | $989 | 36 months and 28 days |
| 172 | Cedar Rapids, IA | $2,153 | $768 | 36 months and 16 days |
| 173 | Worcester, MA | $2,272 | $803 | 36 months and 5 days |
| 174 | Washington, DC | $3,911 | $1,370 | 35 months and 28 days |
| 175 | Columbia, MD | $3,382 | $1,099 | 33 months and 13 days |
| 176 | Madison, WI | $2,214 | $653 | 30 months and 15 days |
| 177 | Seattle, WA | $3,466 | $1,005 | 30 months |
| 178 | Irvine, CA | $3,235 | $825 | 26 months and 16 days |
| 179 | Jersey City, NJ | $2,535 | $646 | 26 months and 15 days |
| 180 | San Jose, CA | $2,714 | $688 | 26 months and 11 days |
| 181 | San Francisco, CA | $3,179 | $719 | 23 months and 19 days |
| 182 | Fremont, CA | $2,579 | $431 | 17 months and 15 days |
Note: *No. 1 = Least Sustainable Credit Card Debt
In-Depth Look at the Cities With the Least Sustainable Credit Card Debt
Gulfport, MS
Gulfport, MS, has the least sustainable credit card debts, with a median balance of $2,997 and a payoff timeline over 105 months (nearly 9 years). Gulfport residents take a long time to pay off their credit card debts in part because their median earnings are very low, at just $42,689 per year. That’s the sixth-lowest among the 182 cities in our study.
Due to low incomes and the pressures of the current economy, Gulfport residents make very small monthly credit card payments, averaging just $62. To put this in perspective, only four cities have a lower average. As a result, the average Gulfport resident will end up paying $3,532 in interest on their credit card debt before it's fully paid off.
North Las Vegas, NV
North Las Vegas, NV, has the second-least sustainable credit card debt among 182 of the largest U.S. cities, as it will take residents with debt an average of nearly 100 months (8.3 years) to pay off what they owe. Some of the major reasons behind North Las Vegas’ long credit card payoff timeline includes the city’s high median credit card debt ($3,271) and relatively low median earnings for workers ($47,405). Residents will end up paying an average of $3,618 in interest by the time they get debt-free, according to WalletHub calculations.
In addition, North Las Vegas residents rank toward the bottom of the country for their money-management skills and only rank 162nd out of 182 cities’ residents for budgeting skills. The average credit score in the city is 669, according to October 2025 TransUnion data, which is right in the middle of the fair credit range.
Tallahassee, FL
Residents of Tallahassee, FL, have the third-least sustainable credit card debt, because it would take an average of nearly 95 months (nearly 8 years) to pay off the typical balance. The median credit card debt is $3,252, and the cost of the interest over the course of 8 years is even more than the original balance – at $3,380.
Tallahassee is one of the many cities where people have more than 3 credit cards, on average. Having multiple credit cards in your wallet can be good for your credit score if you use them wisely, but they can also enable spending beyond your means, which leads to credit score damage. In addition, Tallahassee residents may have trouble keeping up with their debt because they have the 31st-lowest median earnings in the country, at $47,612 per year.
Ask the Experts
With credit-card debt levels remaining high in 2025, we asked a panel of experts to shed light on the unsustainable credit behavior that leads to such negative results and their effects on the economy. Click on the experts’ profiles to read their bios and thoughts on the following key questions:
- What daily behaviors lead people to amass credit-card debt?
- What is the biggest mistake people make when managing credit-card debt?
- How does the growth of credit-card debt affect the economy?
- How will actions taken by the Federal Reserve affect credit card debt in 2026?
- What are the most effective ways to avoid increasing one’s debt load in the context of inflation?
- What role, if any, should the government play in incentivizing and encouraging people to maintain low debt-to-income ratios (e.g., through tax incentives, etc.)?
Ask the Experts

Ph.D. – Assistant Professor, Business Administration and Marketing – St. Joseph’s University, New York
Read More

Ph.D., Lead Faculty Economics – Colorado Christian University
Read More

Ph.D., Professor, Department of Economics and Finance, B.I. Moody III College of Business Administration – University of Louisiana at Lafayette
Read More

Professor, Department of Economics – College of Saint Benedict | Saint John’s University
Read More

Ph.D. – Associate Professor of Mathematics – Guttman Community College
Read More

Ph.D. – Chair & Professor of Economics, Division of Business – DeSales University
Read More
Methodology
In order to determine the cities with the least and most sustainable credit card debts, we first looked at the median credit-card balances of residents in each of 182 U.S. cities as of October 2025, based on TransUnion data. Our analysis includes credit cards that carried a balance and excludes store cards. For our sample, we considered only the city proper in each case, excluding cities in the surrounding metro area.
Using WalletHub’s credit card payoff calculator and the median credit-card balance and income of residents in each city, we determined the required number of months to pay off that balance and the resulting finance charges. In order to do so, we made the following two assumptions:
- Individuals earning the national median income would be able to pay 3 percent of the national median credit card debt. We then took the ratio between that resulting monthly payment and the national median income and applied it to each city’s specific income.
Note: The median income for each city is based on the 2023 earnings of individuals aged 16 and older who worked full-time year-round, according to the U.S. Census Bureau's American Community Survey. The figure excludes income from sources other than work.
- Consumers would pay an average 22.83 percent interest rate, based on the APR paid by existing cardholders, according to the average interest rate assessed on accounts with finance charges. Using that percentage, we computed the cost of paying off the city’s median credit-card balance.
Finally, we ranked the cities based on the calculator’s outputs. A rank of 1 corresponds with the city with the least sustainable credit-card debt — that is, the city with the longest payoff timeline.
Sources: Data used to create this ranking were collected from the U.S. Census Bureau, Federal Reserve and TransUnion.
WalletHub experts are widely quoted. Contact our media team to schedule an interview.