
Home prices have surged in recent years, with the median sales price rising from $313,000 in Q1 2019 to $403,200 in Q1 2026. While prices may be beginning to ease in some parts of the country this year, interest rates have climbed sharply. For instance, the average 30-year fixed mortgage rate increased from a historic low of 2.65% in January 2021 to 6.37% in May 2026.
With both elevated home prices and higher interest rates, many consumers may question whether homeownership is still within reach. Fortunately, buying real estate remains more affordable in certain cities than others.
To determine the most affordable cities for home buyers, WalletHub analyzed 300 U.S. cities using 10 key metrics, including home purchase and maintenance costs, tax rates, and vacancy rates.

Chip Lupo, WalletHub Analyst
Main Findings
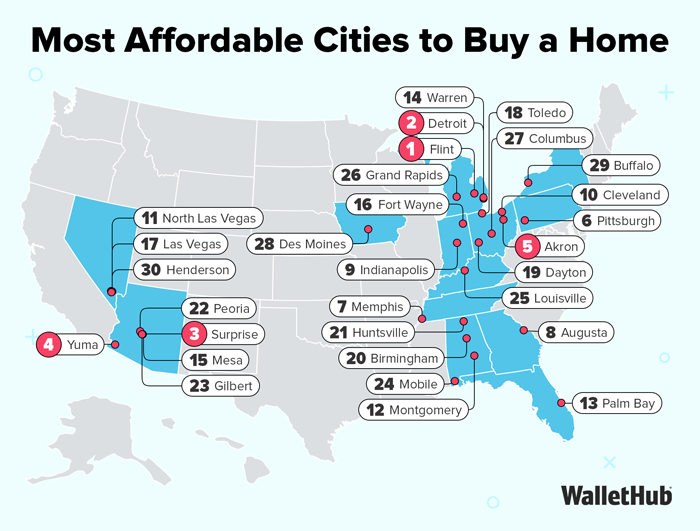
Most Affordable Cities for Home Buyers
Note: *No. 1 = Most Affordable

- Highest
- 1. Flint, MI
- 2. Detroit, MI
- 3. Springfield, IL
- 4. Peoria, IL
- 5. Toledo, OH
- Lowest
- 259. Berkeley, CA
- 260. Costa Mesa, CA
- 261. Glendale, CA
- T-262. Santa Monica, CA
- T-262. Santa Barbara, CA

- Highest
- 1. Sunnyvale, CA
- 2. Santa Clara, CA
- 3. Bellevue, WA
- 4. Naperville, IL
- 5. Cary, NC
- Lowest
- 296. Cleveland, OH
- 297. Dayton, OH
- 298. Hartford, CT
- 299. Detroit, MI
- 300. Flint, MI

- Highest
- T-1. Flint, MI
- T-1. Detroit, MI
- 3. Jackson, MS
- 4. Cleveland, OH
- 5. Dayton, OH
- Lowest
- 296. San Francisco, CA
- 297. Sunnyvale, CA
- 298. Santa Barbara, CA
- 299. Berkeley, CA
- 300. Santa Monica, CA

- Highest
- 1. Miami Beach, FL
- 2. Pompano Beach, FL
- 3. Detroit, MI
- 4. Fort Lauderdale, FL
- 5. New Orleans, LA
- Lowest
- 296. Centennial, CO
- 297. South Gate, CA
- 298. Fontana, CA
- 299. Simi Valley, CA
- 300. Norwalk, CA
In-Depth Look at the Most Affordable Cities
Flint, MI
Flint, MI, is the most affordable city for home buyers, boasting the lowest cost of living index (COLI) in the country and the most affordable home prices relative to residents’ income. It also has the lowest median home price per square footage, at only $59. To put that in perspective, the price in the most expensive cities is over $1,000 per square foot.
Flint also has a very high rent-to-price ratio, which means that it’s actually cheaper to buy property than it is to rent it. To top things off, nearly 20% of all houses in the city are vacant, meaning buyers have a lot of choices. Part of this is likely due to the city’s water crisis, but Flint’s drinking water has now been in compliance with EPA standards for six years.
Detroit, MI
Detroit is the second-most affordable city for homebuyers, with a median house price only being over twice the median household income, the second-lowest rate in the country. The median price per square foot is also very low, at roughly $89.
Due to people moving out of Detroit during past financial crises, nearly 22% of housing in the city is vacant, which makes it a buyers’ market compared to other cities where available houses are scarce. Detroit is also a city where you’ll benefit more from buying a home compared to renting.
Surprise, AZ
Surprise, AZ, is the third-most affordable city for homebuyers, with the 18th-highest median home price appreciation, out of the 300 cities in our study, indicating strong growth in property values. It also has the eighth-lowest median real estate tax rate, helping reduce the overall cost of homeownership.
The city also has the 11th-highest Number of Quarterly Active Listings per 1,000 Residents, offering homebuyers a solid selection of properties to choose from.
Ranking by City Size
| Rank (1=Best) |
Large Cities (Score) |
Rank (1=Best) |
Midsize Cities (Score) |
Rank (1=Best) |
Small Cities (Score) |
|---|---|---|---|---|---|
| 1 | Detroit, MI (74.71) | 1 | Surprise, AZ (73.27) | 1 | Flint, MI (79.50) |
| 2 | Pittsburgh, PA (70.46) | 2 | Akron, OH (70.82) | 2 | Yuma, AZ (72.25) |
| 3 | Memphis, TN (70.00) | 3 | Augusta, GA (69.66) | 3 | Palm Bay, FL (68.58) |
| 4 | Indianapolis, IN (69.56) | 4 | North Las Vegas, NV (68.97) | 4 | Warren, MI (68.52) |
| 5 | Cleveland, OH (69.37) | 5 | Montgomery, AL (68.75) | 5 | Dayton, OH (68.16) |
| 6 | Mesa, AZ (68.39) | 6 | Fort Wayne, IN (68.25) | 6 | Davenport, IA (66.33) |
| 7 | Las Vegas, NV (68.20) | 7 | Toledo, OH (68.17) | 7 | Lakeland, FL (66.31) |
| 8 | Louisville, KY (66.96) | 8 | Birmingham, AL (67.77) | 8 | Livonia, MI (66.03) |
| 9 | Columbus, OH (66.71) | 9 | Huntsville, AL (67.68) | 9 | Cedar Rapids, IA (65.55) |
| 10 | Henderson, NV (66.51) | 10 | Peoria, AZ (67.26) | 10 | Fort Smith, AR (65.30) |
| 11 | Phoenix, AZ (65.40) | 11 | Gilbert, AZ (67.26) | 11 | Pueblo, CO (65.27) |
| 12 | Philadelphia, PA (64.88) | 12 | Mobile, AL (67.07) | 12 | Springfield, IL (64.85) |
| 13 | Charlotte, NC (64.77) | 13 | Grand Rapids, MI (66.85) | 13 | Spokane Valley, WA (64.79) |
| 14 | Atlanta, GA (64.33) | 14 | Des Moines, IA (66.58) | 14 | Broken Arrow, OK (64.64) |
| 15 | Raleigh, NC (64.20) | 15 | Buffalo, NY (66.56) | 15 | Lansing, MI (64.63) |
| 16 | Cincinnati, OH (64.20) | 16 | Fayetteville, NC (66.44) | 16 | High Point, NC (64.41) |
| 17 | Tucson, AZ (64.09) | 17 | Murfreesboro, TN (66.13) | 17 | Sterling Heights, MI (64.41) |
| 18 | Lexington, KY (63.59) | 18 | Columbus, GA (66.05) | 18 | North Charleston, SC (64.23) |
| 19 | Baltimore, MD (63.54) | 19 | Spokane, WA (65.98) | 19 | Hampton, VA (64.19) |
| 20 | Virginia Beach, VA (63.47) | 20 | Chandler, AZ (65.80) | 20 | Kenosha, WI (63.89) |
| 21 | Jacksonville, FL (63.41) | 21 | Little Rock, AR (65.13) | 21 | Hillsboro, OR (63.83) |
| 22 | Colorado Springs, CO (63.38) | 22 | Glendale, AZ (65.04) | 22 | Green Bay, WI (63.83) |
| 23 | Nashville, TN (63.09) | 23 | Cape Coral, FL (64.92) | 23 | Dearborn, MI (63.78) |
| 24 | Greensboro, NC (62.98) | 24 | Cary, NC (64.63) | 24 | Tuscaloosa, AL (63.76) |
| 25 | Milwaukee, WI (62.79) | 25 | Winston-Salem, NC (64.28) | 25 | Erie, PA (63.51) |
| 26 | Orlando, FL (62.54) | 26 | Boise, ID (64.24) | 26 | Rockford, IL (63.44) |
| 27 | Oklahoma City, OK (62.54) | 27 | Durham, NC (63.99) | 27 | Clearwater, FL (63.25) |
| 28 | Tulsa, OK (62.10) | 28 | Chesapeake, VA (63.97) | 28 | Savannah, GA (62.93) |
| 29 | Omaha, NE (62.03) | 29 | Joliet, IL (63.85) | 29 | Peoria, IL (62.81) |
| 30 | Aurora, CO (60.98) | 30 | Knoxville, TN (63.81) | 30 | Portsmouth, VA (62.60) |
| 31 | Minneapolis, MN (60.81) | 31 | Newport News, VA (62.94) | 31 | Roanoke, VA (62.50) |
| 32 | Tampa, FL (59.45) | 32 | Tempe, AZ (62.62) | 32 | Roswell, GA (62.35) |
| 33 | Fresno, CA (58.73) | 33 | Reno, NV (62.51) | 33 | Sunrise, FL (61.91) |
| 34 | Kansas City, MO (58.73) | 34 | Salem, OR (62.28) | 34 | Victorville, CA (61.84) |
| 35 | Wichita, KS (58.44) | 35 | Aurora, IL (61.46) | 35 | Beaverton, OR (61.53) |
| 36 | Portland, OR (58.29) | 36 | Lincoln, NE (61.20) | 36 | Yakima, WA (61.34) |
| 37 | Bakersfield, CA (57.71) | 37 | Norfolk, VA (61.20) | 37 | Thornton, CO (61.26) |
| 38 | Chicago, IL (57.25) | 38 | Vancouver, WA (60.80) | 38 | Allentown, PA (61.15) |
| 39 | Stockton, CA (57.19) | 39 | Salt Lake City, UT (60.75) | 39 | Visalia, CA (60.72) |
| 40 | Denver, CO (57.03) | 40 | Rochester, NY (60.67) | 40 | Gresham, OR (60.51) |
| 41 | Albuquerque, NM (56.88) | 41 | Charleston, SC (60.51) | 41 | Elgin, IL (60.41) |
| 42 | Sacramento, CA (55.28) | 42 | Scottsdale, AZ (60.41) | 42 | Waukegan, IL (60.34) |
| 43 | San Antonio, TX (55.12) | 43 | St. Louis, MO (60.40) | 43 | Arvada, CO (60.29) |
| 44 | Corpus Christi, TX (55.11) | 44 | Lancaster, CA (60.23) | 44 | Centennial, CO (60.23) |
| 45 | Fort Worth, TX (54.39) | 45 | Richmond, VA (60.10) | 45 | Westminster, CO (59.91) |
| 46 | Houston, TX (53.97) | 46 | Naperville, IL (59.49) | 46 | Norman, OK (59.86) |
| 47 | St. Paul, MN (53.05) | 47 | Tacoma, WA (59.46) | 47 | Pompano Beach, FL (59.84) |
| 48 | Arlington, TX (52.61) | 48 | Springfield, MO (59.28) | 48 | West Palm Beach, FL (59.72) |
| 49 | Riverside, CA (52.26) | 49 | Madison, WI (58.73) | 49 | Athens-Clarke, GA (59.67) |
| 50 | Washington, DC (52.10) | 50 | Port St. Lucie, FL (58.47) | 50 | Jackson, MS (59.62) |
| 51 | New Orleans, LA (51.82) | 51 | Tallahassee, FL (57.99) | 51 | Wilmington, NC (59.51) |
| 52 | Dallas, TX (50.70) | 52 | St. Petersburg, FL (57.92) | 52 | Greeley, CO (58.60) |
| 53 | Seattle, WA (50.04) | 53 | Elk Grove, CA (57.66) | 53 | Clovis, CA (57.67) |
| 54 | El Paso, TX (49.15) | 54 | Modesto, CA (57.18) | 54 | Manchester, NH (57.25) |
| 55 | Austin, TX (48.78) | 55 | Moreno Valley, CA (57.15) | 55 | Boca Raton, FL (57.11) |
| 56 | Oakland, CA (45.56) | 56 | Lakewood, CO (56.58) | 56 | Sandy Springs, GA (56.92) |
| 57 | Miami, FL (45.39) | 57 | Eugene, OR (56.57) | 57 | Albany, NY (56.02) |
| 58 | Santa Ana, CA (42.61) | 58 | Palmdale, CA (56.49) | 58 | Kent, WA (55.20) |
| 59 | Newark, NJ (42.27) | 59 | Roseville, CA (56.44) | 59 | Federal Way, WA (55.14) |
| 60 | San Diego, CA (41.11) | 60 | Baton Rouge, LA (55.81) | 60 | Murrieta, CA (55.06) |
| 61 | Honolulu, HI (41.01) | 61 | Overland Park, KS (55.79) | 61 | Ann Arbor, MI (55.04) |
| 62 | Anaheim, CA (40.53) | 62 | Springfield, MA (54.98) | 62 | Vacaville, CA (55.02) |
| 63 | Long Beach, CA (39.44) | 63 | Alexandria, VA (54.95) | 63 | Vallejo, CA (54.90) |
| 64 | San Jose, CA (37.52) | 64 | San Bernardino, CA (54.87) | 64 | Mesquite, TX (54.78) |
| 65 | Boston, MA (35.44) | 65 | Pembroke Pines, FL (53.93) | 65 | Longmont, CO (54.53) |
| 66 | Irvine, CA (33.98) | 66 | Fort Collins, CO (53.85) | 66 | Everett, WA (54.47) |
| 67 | San Francisco, CA (33.29) | 67 | Amarillo, TX (53.66) | 67 | Plantation, FL (54.33) |
| 68 | New York, NY (33.14) | 68 | Fontana, CA (53.29) | 68 | Gainesville, FL (54.32) |
| 69 | Los Angeles, CA (32.37) | 69 | Worcester, MA (52.89) | 69 | Rialto, CA (54.18) |
| Info | 70 | Grand Prairie, TX (52.83) | 70 | Davie, FL (54.12) | |
| Info | 71 | McKinney, TX (52.76) | 71 | Fairfield, CA (53.94) | |
| Info | 72 | Garland, TX (52.66) | 72 | Antioch, CA (53.82) | |
| Info | 73 | Irving, TX (52.43) | 73 | Renton, WA (53.30) | |
| Info | 74 | Fort Lauderdale, FL (52.22) | 74 | Chico, CA (52.67) | |
| Info | 75 | Hollywood, FL (51.90) | 75 | Temecula, CA (52.64) | |
| Info | 76 | Anchorage, AK (51.61) | 76 | Miami Gardens, FL (51.85) | |
| Info | 77 | Shreveport, LA (51.28) | 77 | Miramar, FL (51.53) | |
| Info | 78 | Ontario, CA (51.27) | 78 | Coral Springs, FL (51.28) | |
| Info | 79 | Santa Clarita, CA (50.98) | 79 | Waterbury, CT (50.99) | |
| Info | 80 | Denton, TX (50.79) | 80 | Carrollton, TX (50.45) | |
| Info | 81 | Frisco, TX (50.37) | 81 | Hartford, CT (50.13) | |
| Info | 82 | Corona, CA (50.25) | 82 | Richardson, TX (50.00) | |
| Info | 83 | Providence, RI (50.02) | 83 | Allen, TX (49.89) | |
| Info | 84 | Laredo, TX (49.32) | 84 | Santa Maria, CA (49.75) | |
| Info | 85 | Rancho Cucamonga, CA (49.28) | 85 | Brockton, MA (49.01) | |
| Info | 86 | Plano, TX (48.20) | 86 | Carson, CA (48.89) | |
| Info | 87 | Chula Vista, CA (47.80) | 87 | Concord, CA (48.43) | |
| Info | 88 | Santa Rosa, CA (46.96) | 88 | Lowell, MA (48.14) | |
| Info | 89 | Hialeah, FL (46.76) | 89 | Simi Valley, CA (47.78) | |
| Info | 90 | Hayward, CA (46.68) | 90 | New Haven, CT (47.52) | |
| Info | 91 | Yonkers, NY (46.52) | 91 | Richmond, CA (47.23) | |
| Info | 92 | Jersey City, NJ (46.14) | 92 | Fall River, MA (45.83) | |
| Info | 93 | Salinas, CA (46.07) | 93 | Stamford, CT (45.82) | |
| Info | 94 | Oceanside, CA (45.54) | 94 | Bridgeport, CT (45.70) | |
| Info | 95 | Bellevue, WA (44.86) | 95 | West Covina, CA (45.59) | |
| Info | 96 | Oxnard, CA (44.61) | 96 | Compton, CA (45.51) | |
| Info | 97 | Fremont, CA (41.13) | 97 | Pomona, CA (45.30) | |
| Info | 98 | Paterson, NJ (39.35) | 98 | Escondido, CA (45.00) | |
| Info | 99 | Garden Grove, CA (37.84) | 99 | New Bedford, MA (44.93) | |
| Info | 100 | Sunnyvale, CA (36.26) | 100 | Norwalk, CA (44.36) | |
| Info | 101 | Huntington Beach, CA (35.62) | 101 | Elizabeth, NJ (44.05) | |
| Info | 102 | Glendale, CA (29.19) | 102 | Vista, CA (43.72) | |
| Info | Info | 103 | Quincy, MA (43.54) | ||
| Info | Info | 104 | Ventura, CA (43.53) | ||
| Info | Info | 105 | Lynn, MA (43.17) | ||
| Info | Info | 106 | Mission Viejo, CA (43.06) | ||
| Info | Info | 107 | Thousand Oaks, CA (42.72) | ||
| Info | Info | 108 | Miami Beach, FL (41.18) | ||
| Info | Info | 109 | Daly City, CA (41.05) | ||
| Info | Info | 110 | Inglewood, CA (40.89) | ||
| Info | Info | 111 | South Gate, CA (40.60) | ||
| Info | Info | 112 | Torrance, CA (40.41) | ||
| Info | Info | 113 | Orange, CA (40.21) | ||
| Info | Info | 114 | Carlsbad, CA (39.79) | ||
| Info | Info | 115 | Fullerton, CA (39.55) | ||
| Info | Info | 116 | Downey, CA (38.98) | ||
| Info | Info | 117 | El Cajon, CA (37.33) | ||
| Info | Info | 118 | El Monte, CA (36.73) | ||
| Info | Info | 119 | Boulder, CO (36.71) | ||
| Info | Info | 120 | Santa Clara, CA (36.50) | ||
| Info | Info | 121 | Cambridge, MA (34.92) | ||
| Info | Info | 122 | San Mateo, CA (34.84) | ||
| Info | Info | 123 | Burbank, CA (33.77) | ||
| Info | Info | 124 | Westminster, CA (33.58) | ||
| Info | Info | 125 | Pasadena, CA (32.68) | ||
| Info | Info | 126 | Berkeley, CA (29.65) | ||
| Info | Info | 127 | Costa Mesa, CA (28.75) | ||
| Info | Info | 128 | Santa Monica, CA (23.70) | ||
| Info | Info | 129 | Santa Barbara, CA (22.68) |
Ask the Experts
In order to get more insight into affording a home during this difficult economic period, WalletHub turned to a panel of experts. You can click on the pictures of the experts below to read their bios and responses to the following key questions:
- What should home buyers consider when choosing a city to settle down?
- What are your housing market predictions for 2026?
- Will home prices finally become affordable this year?
- When in 2026 should home buyers consider making a purchase? Is 2026 a good year to buy a home?
- How can state and local authorities increase home buying affordability?
Ask the Experts

Ph.D., CFA, CFP® – Professor of Finance, Joel C. Peterson Professorship, Brigham Young University, Editor-in-Chief Journal of Entrepreneurial Finance
Read More

Ph.D. – Associate Professor, College of Business and Management - Lynn University
Read More

Floyd R. Gibson Endowed Professor - University of Missouri School of Law
Read More

Professor of Finance, Monfort College of Business - University of Northern Colorado
Read More

Ph.D., CFA, Assistant Professor of Real Estate, Pamplin College of Business - Virginia Tech
Read More

Ph.D., Associate Professor of Real Estate, Editor Review of Regional Studies, Department of Finance, Strome College of Business - Old Dominion University
Read More
Methodology
To determine the most affordable cities for home buyers, WalletHub compared a sample of 300 U.S. cities (varying in size) across ten key metrics, which are listed below with their corresponding weights. Each metric was graded on a 100-point scale, with a score of 100 representing the most favorable conditions for home affordability. Data for metrics marked with an asterisk (*) were available at the state level only.
Finally, we determined each city’s weighted average across all metrics to calculate its overall score and used the resulting scores to rank-order our sample. Our sample considers only the city proper in each case and excludes cities in the surrounding metro area. Each city was categorized according to the following population-size guidelines:
- Large cities: More than 300,000 people
- Midsize cities: 150,000 to 300,000 people
- Small cities: Fewer than 150,000 people
- Housing Affordability: Triple Weight (~25.00 Points)
Note: This metric was calculated as follows: Median House Price / Median Annual Household Income. - Maintenance Affordability: Full Weight (~8.33 Points)
Note: This metric measures maintenance costs as share of income. - Average Cost of Homeowner’s Insurance*: Full Weight (~8.33 Points)
- Cost of Living: Full Weight (~8.33 Points)
- Cost per Square Foot: Double Weight (~16.67 Points)
Note: This metric measures specifically the median list price per average home square footage. - Real-Estate Tax Rate: Full Weight (~8.33 Points)
- Rent-to-Price-Ratio: Full Weight (~8.33 Points)
- Median Home-Price Appreciation: Full Weight (~8.33 Points)
- Quarterly Active Listings per Capita: Half Weight (~4.17 Points)
- Vacancy Rate: Half Weight (~4.17 Points)
Note: This metric was calculated as follows: Vacant Housing Units / Total Housing Units.
Sources: Data used to create this ranking were collected as of April 21, 2026 from the U.S. Census Bureau, The National Association of Realtors, Council for Community and Economic Research and Insurance Information Institute.


WalletHub's personal finance experts are frequently cited by leading media outlets. Contact our media team to arrange an interview.