
About 72% of Americans are planning to travel this summer, but inflation may lead many to scale back spending and choose more budget-friendly vacations. The good news is that you don’t have to go far to enjoy a memorable getaway. Many nearby cities offer affordable options for entertainment, dining, and relaxation.
To identify the best destinations for an enjoyable and cost-effective staycation, WalletHub analyzed more than 180 cities using 41 key indicators, including factors such as parks per capita and average restaurant meal prices.

Chip Lupo, WalletHub Analyst
Main Findings
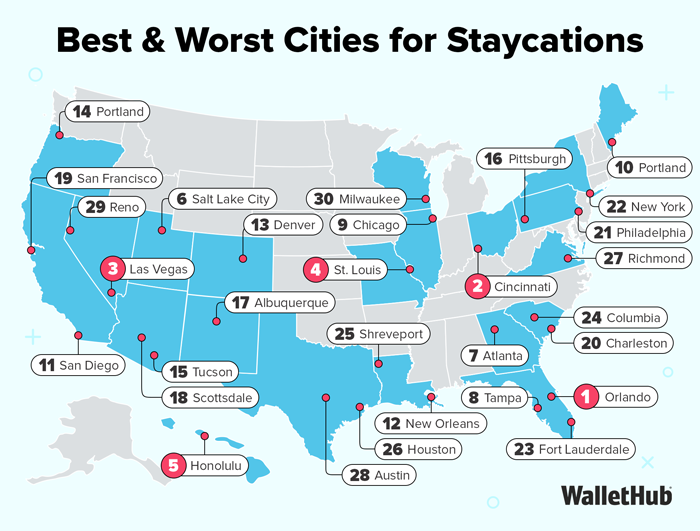
Best Places for a Staycation
| Overall Rank | City | Total Score | Recreation Rank | Food & Entertainment Rank | Rest & Relaxation Rank |
|---|---|---|---|---|---|
| 1 | Orlando, FL | 65.13 | 20 | 1 | 7 |
| 2 | Cincinnati, OH | 63.97 | 9 | 7 | 8 |
| 3 | Las Vegas, NV | 63.01 | 14 | 4 | 12 |
| 4 | St. Louis, MO | 61.46 | 32 | 2 | 14 |
| 5 | Honolulu, HI | 60.29 | 1 | 22 | 117 |
| 6 | Salt Lake City, UT | 60.13 | 7 | 19 | 26 |
| 7 | Atlanta, GA | 59.80 | 13 | 10 | 58 |
| 8 | Tampa, FL | 58.63 | 30 | 13 | 20 |
| 9 | Chicago, IL | 58.42 | 6 | 20 | 70 |
| 10 | Portland, ME | 58.36 | 2 | 37 | 86 |
| 11 | San Diego, CA | 58.00 | 17 | 16 | 36 |
| 12 | New Orleans, LA | 57.94 | 40 | 5 | 39 |
| 13 | Denver, CO | 57.14 | 12 | 24 | 51 |
| 14 | Portland, OR | 56.98 | 25 | 3 | 90 |
| 15 | Tucson, AZ | 56.74 | 21 | 28 | 18 |
| 16 | Pittsburgh, PA | 56.37 | 38 | 9 | 61 |
| 17 | Albuquerque, NM | 56.00 | 28 | 18 | 33 |
| 18 | Scottsdale, AZ | 55.66 | 47 | 39 | 3 |
| 19 | San Francisco, CA | 55.58 | 5 | 8 | 166 |
| 20 | Charleston, SC | 55.53 | 34 | 29 | 25 |
| 21 | Philadelphia, PA | 54.07 | 11 | 23 | 115 |
| 22 | New York, NY | 53.66 | 4 | 44 | 146 |
| 23 | Fort Lauderdale, FL | 53.60 | 3 | 70 | 97 |
| 24 | Columbia, SC | 53.38 | 152 | 21 | 10 |
| 25 | Shreveport, LA | 52.33 | 131 | 65 | 2 |
| 26 | Houston, TX | 52.27 | 36 | 12 | 125 |
| 27 | Richmond, VA | 52.21 | 26 | 25 | 98 |
| 28 | Austin, TX | 51.81 | 39 | 11 | 132 |
| 29 | Reno, NV | 51.33 | 75 | 38 | 11 |
| 30 | Milwaukee, WI | 51.22 | 19 | 17 | 135 |
| 31 | Miami, FL | 50.93 | 29 | 6 | 163 |
| 32 | Chattanooga, TN | 50.90 | 59 | 54 | 42 |
| 33 | Louisville, KY | 50.76 | 50 | 41 | 66 |
| 34 | Springfield, MO | 50.61 | 153 | 77 | 6 |
| 35 | Seattle, WA | 50.43 | 22 | 15 | 152 |
| 36 | Los Angeles, CA | 50.12 | 16 | 51 | 126 |
| 37 | Knoxville, TN | 50.03 | 89 | 42 | 50 |
| 38 | Minneapolis, MN | 49.95 | 33 | 49 | 94 |
| 39 | Boise, ID | 49.95 | 48 | 73 | 52 |
| 40 | Omaha, NE | 49.89 | 43 | 50 | 75 |
| 41 | Virginia Beach, VA | 49.86 | 54 | 98 | 15 |
| 42 | St. Petersburg, FL | 49.82 | 42 | 52 | 85 |
| 43 | Washington, DC | 49.78 | 8 | 26 | 175 |
| 44 | Henderson, NV | 49.73 | 68 | 94 | 5 |
| 45 | Tulsa, OK | 49.66 | 93 | 59 | 4 |
| 46 | Tempe, AZ | 49.56 | 27 | 46 | 112 |
| 47 | Kansas City, MO | 49.46 | 74 | 27 | 69 |
| 48 | Fort Smith, AR | 49.25 | 130 | 150 | 1 |
| 49 | Sacramento, CA | 49.21 | 61 | 31 | 88 |
| 50 | Overland Park, KS | 49.02 | 94 | 105 | 22 |
| 51 | Wilmington, DE | 48.92 | 72 | 63 | 54 |
| 52 | Burlington, VT | 48.68 | 18 | 80 | 104 |
| 53 | Birmingham, AL | 48.33 | 129 | 33 | 76 |
| 54 | Rochester, NY | 48.09 | 52 | 40 | 128 |
| 55 | San Antonio, TX | 48.01 | 83 | 14 | 119 |
| 56 | Missoula, MT | 47.84 | 58 | 123 | 37 |
| 57 | El Paso, TX | 47.53 | 98 | 48 | 24 |
| 58 | Billings, MT | 47.44 | 110 | 69 | 62 |
| 59 | Columbus, OH | 47.37 | 69 | 62 | 60 |
| 60 | Amarillo, TX | 47.19 | 171 | 92 | 13 |
| 61 | Norfolk, VA | 47.15 | 44 | 112 | 77 |
| 62 | Cleveland, OH | 46.91 | 57 | 35 | 129 |
| 63 | Vancouver, WA | 46.86 | 104 | 79 | 49 |
| 64 | Phoenix, AZ | 46.71 | 65 | 57 | 91 |
| 65 | Grand Rapids, MI | 46.58 | 70 | 76 | 89 |
| 66 | Plano, TX | 46.54 | 60 | 97 | 73 |
| 67 | Jacksonville, FL | 46.54 | 37 | 61 | 133 |
| 68 | Dallas, TX | 46.38 | 45 | 64 | 120 |
| 69 | Sioux Falls, SD | 46.35 | 144 | 88 | 47 |
| 70 | Modesto, CA | 46.28 | 150 | 84 | 35 |
| 71 | Nashville, TN | 46.28 | 71 | 34 | 111 |
| 72 | Ontario, CA | 46.27 | 81 | 138 | 46 |
| 73 | Oklahoma City, OK | 46.19 | 116 | 53 | 23 |
| 74 | Fayetteville, NC | 46.11 | 179 | 103 | 16 |
| 75 | Mobile, AL | 45.95 | 143 | 78 | 65 |
| 76 | Rapid City, SD | 45.87 | 97 | 81 | 71 |
| 77 | Huntsville, AL | 45.60 | 151 | 107 | 34 |
| 78 | Colorado Springs, CO | 45.35 | 78 | 43 | 105 |
| 79 | Spokane, WA | 45.15 | 92 | 86 | 41 |
| 80 | Fargo, ND | 45.07 | 140 | 96 | 44 |
| 81 | Boston, MA | 44.93 | 10 | 45 | 180 |
| 82 | Akron, OH | 44.83 | 108 | 121 | 43 |
| 83 | Baton Rouge, LA | 44.76 | 95 | 47 | 93 |
| 84 | Jackson, MS | 44.32 | 180 | 128 | 9 |
| 85 | Buffalo, NY | 44.22 | 51 | 56 | 155 |
| 86 | Gulfport, MS | 44.03 | 103 | 126 | 57 |
| 87 | Lincoln, NE | 43.94 | 79 | 111 | 53 |
| 88 | Providence, RI | 43.94 | 55 | 71 | 147 |
| 89 | Nampa, ID | 43.92 | 139 | 160 | 17 |
| 90 | Las Cruces, NM | 43.86 | 121 | 143 | 28 |
| 91 | St. Paul, MN | 43.68 | 49 | 67 | 156 |
| 92 | Indianapolis, IN | 43.55 | 102 | 36 | 130 |
| 93 | Bakersfield, CA | 43.43 | 168 | 75 | 19 |
| 94 | Glendale, AZ | 43.39 | 105 | 100 | 63 |
| 95 | Augusta, GA | 43.28 | 176 | 115 | 27 |
| 96 | Madison, WI | 43.20 | 23 | 89 | 171 |
| 97 | Riverside, CA | 42.99 | 132 | 102 | 31 |
| 98 | Salem, OR | 42.96 | 157 | 95 | 79 |
| 99 | Fort Worth, TX | 42.94 | 136 | 90 | 29 |
| 100 | Bismarck, ND | 42.94 | 90 | 114 | 95 |
| 101 | Cape Coral, FL | 42.76 | 62 | 166 | 67 |
| 102 | San Bernardino, CA | 42.67 | 170 | 142 | 21 |
| 103 | Casper, WY | 42.48 | 126 | 99 | 106 |
| 104 | Charlotte, NC | 42.42 | 100 | 32 | 145 |
| 105 | Chandler, AZ | 42.39 | 133 | 87 | 59 |
| 106 | Cedar Rapids, IA | 42.27 | 147 | 116 | 80 |
| 107 | Raleigh, NC | 42.22 | 101 | 55 | 127 |
| 108 | Winston-Salem, NC | 42.16 | 146 | 104 | 38 |
| 109 | Columbus, GA | 42.14 | 178 | 119 | 48 |
| 110 | Lexington-Fayette, KY | 42.12 | 128 | 82 | 72 |
| 111 | Mesa, AZ | 42.06 | 91 | 101 | 87 |
| 112 | Tacoma, WA | 42.03 | 117 | 83 | 121 |
| 113 | South Burlington, VT | 41.70 | 56 | 152 | 122 |
| 114 | Glendale, CA | 41.66 | 35 | 148 | 124 |
| 115 | Corpus Christi, TX | 41.59 | 109 | 120 | 82 |
| 116 | Rancho Cucamonga, CA | 41.46 | 174 | 137 | 45 |
| 117 | Toledo, OH | 41.05 | 115 | 108 | 81 |
| 118 | Pembroke Pines, FL | 40.99 | 67 | 155 | 107 |
| 119 | Fontana, CA | 40.66 | 138 | 157 | 64 |
| 120 | Newport News, VA | 40.43 | 165 | 141 | 78 |
| 121 | Durham, NC | 40.41 | 118 | 66 | 123 |
| 122 | Arlington, TX | 40.36 | 106 | 106 | 99 |
| 123 | Lubbock, TX | 40.13 | 172 | 118 | 32 |
| 124 | Anchorage, AK | 40.12 | 46 | 74 | 179 |
| 125 | Montgomery, AL | 39.88 | 173 | 127 | 92 |
| 126 | Dover, DE | 39.84 | 86 | 163 | 100 |
| 127 | Moreno Valley, CA | 39.79 | 175 | 167 | 30 |
| 128 | Greensboro, NC | 39.77 | 141 | 72 | 103 |
| 129 | Baltimore, MD | 39.77 | 63 | 60 | 176 |
| 130 | Wichita, KS | 39.68 | 148 | 30 | 149 |
| 131 | Detroit, MI | 39.68 | 111 | 68 | 151 |
| 132 | Huntington Beach, CA | 39.66 | 31 | 134 | 162 |
| 133 | Brownsville, TX | 39.56 | 177 | 161 | 40 |
| 134 | Cheyenne, WY | 39.46 | 142 | 140 | 102 |
| 135 | Stockton, CA | 39.43 | 135 | 146 | 56 |
| 135 | Peoria, AZ | 39.43 | 88 | 158 | 101 |
| 137 | Memphis, TN | 39.37 | 122 | 58 | 153 |
| 138 | Fresno, CA | 39.35 | 162 | 110 | 55 |
| 139 | Fort Wayne, IN | 39.17 | 163 | 93 | 96 |
| 140 | Irvine, CA | 39.12 | 41 | 136 | 172 |
| 141 | Tallahassee, FL | 39.03 | 167 | 91 | 141 |
| 142 | North Las Vegas, NV | 38.63 | 96 | 165 | 68 |
| 143 | Aurora, IL | 38.42 | 80 | 162 | 118 |
| 144 | West Valley City, UT | 38.27 | 53 | 180 | 74 |
| 145 | Long Beach, CA | 38.15 | 73 | 85 | 174 |
| 146 | Garden Grove, CA | 38.00 | 24 | 147 | 165 |
| 147 | Nashua, NH | 37.92 | 87 | 171 | 108 |
| 148 | Charleston, WV | 37.88 | 159 | 124 | 140 |
| 149 | Gilbert, AZ | 37.76 | 160 | 129 | 84 |
| 150 | Chesapeake, VA | 37.70 | 85 | 149 | 134 |
| 151 | Santa Rosa, CA | 37.63 | 84 | 144 | 143 |
| 152 | Aurora, CO | 37.47 | 114 | 109 | 150 |
| 153 | Bridgeport, CT | 37.43 | 64 | 174 | 116 |
| 154 | Little Rock, AR | 37.19 | 164 | 122 | 136 |
| 155 | Worcester, MA | 36.91 | 112 | 154 | 131 |
| 156 | San Jose, CA | 36.00 | 76 | 135 | 167 |
| 157 | Port St. Lucie, FL | 35.91 | 181 | 130 | 83 |
| 158 | Grand Prairie, TX | 35.85 | 119 | 176 | 113 |
| 159 | Anaheim, CA | 35.58 | 145 | 117 | 138 |
| 160 | Oxnard, CA | 35.46 | 113 | 170 | 110 |
| 161 | Oceanside, CA | 35.37 | 66 | 151 | 169 |
| 162 | Des Moines, IA | 35.29 | 134 | 125 | 154 |
| 163 | Lewiston, ME | 35.25 | 137 | 177 | 109 |
| 164 | Warwick, RI | 34.75 | 77 | 168 | 157 |
| 165 | Garland, TX | 34.41 | 155 | 145 | 144 |
| 166 | New Haven, CT | 34.37 | 149 | 132 | 158 |
| 167 | Columbia, MD | 34.37 | 166 | 175 | 114 |
| 168 | Manchester, NH | 34.28 | 161 | 164 | 137 |
| 169 | Huntington, WV | 34.24 | 99 | 169 | 148 |
| 170 | Jersey City, NJ | 33.74 | 120 | 131 | 168 |
| 171 | Santa Clarita, CA | 32.97 | 154 | 153 | 142 |
| 172 | Juneau, AK | 32.52 | 15 | 133 | 182 |
| 173 | Oakland, CA | 32.42 | 82 | 113 | 181 |
| 174 | Santa Ana, CA | 32.33 | 127 | 139 | 173 |
| 175 | Newark, NJ | 32.26 | 125 | 156 | 164 |
| 176 | Hialeah, FL | 32.08 | 107 | 179 | 139 |
| 177 | Laredo, TX | 31.83 | 124 | 173 | 159 |
| 178 | Irving, TX | 30.08 | 169 | 159 | 161 |
| 179 | Chula Vista, CA | 28.61 | 158 | 178 | 160 |
| 180 | Fremont, CA | 27.71 | 156 | 172 | 178 |
| 181 | Yonkers, NY | 26.23 | 123 | 182 | 170 |
| 182 | Pearl City, HI | 23.47 | 182 | 181 | 177 |
Note: With the exception of “Total Score,” all of the columns in the table above depict the relative rank of that city, where a rank of 1 represents the best conditions for that metric category.

- Most
- T-1. Cleveland, OH
- T-1. Philadelphia, PA
- 3. Chicago, IL
- 4. Atlanta, GA
- 5. Washington, DC
- Fewest
- 96. Fremont, CA
- 97. Garland, TX
- 98. Lubbock, TX
- 99. Madison, WI
- 100. Detroit, MI

- Most
- T-1. Honolulu, HI
- T-1. Richmond, VA
- T-1. Norfolk, VA
- 4. Omaha, NE
- 5. Atlanta, GA
- Fewest
- 99. Fort Worth, TX
- 100. Riverside, CA
- 101. Gilbert, AZ
- 102. Irving, TX
- 103. Mesa, AZ

- Most
- T-1. Warwick, RI
- T-1. Peoria, AZ
- T-1. Gilbert, AZ
- 4. Fort Lauderdale, FL
- 5. Tempe, AZ
- Fewest
- 175. Chicago, IL
- 176. El Paso, TX
- 177. Bakersfield, CA
- 178. New York, NY
- 179. Laredo, TX

- Most
- T-1. St. Louis, MO
- T-1. Miami, FL
- T-1. Las Vegas, NV
- T-1. Orlando, FL
- T-1. Tampa, FL
- Fewest
- 112. Indianapolis, IN
- 113. Columbus, OH
- 114. San Jose, CA
- 115. Phoenix, AZ
- 116. New York, NY

- Most
- T-1. Orlando, FL
- T-1. Miami, FL
- T-1. Las Vegas, NV
- T-1. Atlanta, GA
- T-1. Pittsburgh, PA
- Fewest
- 178. Pearl City, HI
- 179. Charleston, WV
- 180. Casper, WY
- 181. Lewiston, ME
- 182. South Burlington, VT

- Most
- T-1. Milwaukee, WI
- T-1. Portland, OR
- T-1. New York, NY
- T-1. San Francisco, CA
- T-1. Denver, CO
- Fewest
- 103. Arlington, TX
- 104. Minneapolis, MN
- 105. Virginia Beach, VA
- 106. Fresno, CA
- 107. Oklahoma City, OK

- Most
- 1. Salt Lake City, UT
- 2. Spokane, WA
- 3. Richmond, VA
- 4. Pittsburgh, PA
- 5. Fort Lauderdale, FL
- Fewest
- 178. Bridgeport, CT
- 179. West Valley City, UT
- 180. New York, NY
- 181. Columbus, GA
- 182. Pearl City, HI

- Most
- T-1. New Orleans, LA
- T-1. New York, NY
- T-1. Miami, FL
- T-1. San Francisco, CA
- T-1. Seattle, WA
- Fewest
- 176. Garland, TX
- 177. Chesapeake, VA
- 178. North Las Vegas, NV
- 179. Peoria, AZ
- 180. Chula Vista, CA

- Most
- T-1. Las Vegas, NV
- T-1. Miami, FL
- T-1. Honolulu, HI
- T-1. Scottsdale, AZ
- T-1. New York, NY
- Fewest
- 178. Anaheim, CA
- 179. West Valley City, UT
- 180. North Las Vegas, NV
- 181. Pearl City, HI
- 182. Fontana, CA
In-Depth Look at the Best Cities for Staycations
Orlando, FL
Orlando, FL, is the best city for a staycation, due to the fact that there are so many different things to do in the city. Orlando has an extremely high number of amusement parks, water parks, nightlife activities, festivals, zoos and arcades per capita, so it’s easy to fill a week with different fun outings every day.
Orlando is also a great place to eat out, with plenty of affordable restaurants rated at least 4.5 stars out of 5 and very diverse restaurant types. There are also lots of ice cream shops for dessert during the hot summer.
Cincinnati, OH
Cincinnati is the second-best city for staycations, and it's especially good for outdoor activities. The city has a large number of parks, swimming pools, and baseball fields to keep people entertained and active.
In addition, Cincinnati ranks among the best cities when it comes to the prevalence of affordable restaurants with at least 4.5 out of 5 stars. After all, most people don’t want to cook for themselves or do dishes while taking a staycation. The city also has many beer gardens and ice cream shops for those looking to get their alcohol and dessert fixes.
To top things off, Cincinnati has a relatively low cost of hiring a maid for a house cleaning, at $92, so after you’re done with a fun day trip, you can come home to a clean house without having to do any of the work.
Las Vegas, NV
Las Vegas is the third-best city for a staycation. The city offers plenty of opportunities to play golf or basketball, swim, hike, or rent bikes, so you can enjoy the outdoor scenery while staying active.
It is also no surprise that Las Vegas has a large number of casinos, if you're willing to try your luck, and plenty of arcades, making it an exciting destination for both adventure seekers and those looking to indulge in some nostalgic fun.
Finally, Las Vegas has a lot of affordable, good-quality restaurants, and it boasts a high number of spas, which are a great day trip idea during a staycation.
Ask the Experts
There’s a difference between a staycation and business as usual in the context of staying local. And it all has to do with how you spend your time in the city you call home. For advice on making the best of your staycation, we asked a panel of experts to share their thoughts on the following key questions:
- What are the best ways to enjoy a staycation?
- What activities can families do locally without breaking the bank?
- What is the best time of year to have a staycation?
- In evaluating the best cities for staycations, what are the top five indicators?
- Have staycations become more popular due to inflation?
Ask the Experts

Ph.D. – Associate Professor, College of Business and Management - Lynn University
Read More

Ph.D., Director & Professor, Fritz Knoebel School of Hospitality Management, Daniels College of Business, University of Denver
Read More

Ph.D., Professor, Hospitality and Tourism Management - Grand Valley State University
Read More

Senior Lecturer, Recreation & Outdoor Education and the Environment & Sustainability program, ROE Program Coordinator, Co-Director Headwaters First Year Seminar Program - Western Colorado University
Read More

Ph.D., Professor, Hospitality Leadership - Missouri State University
Read More

Lecturer and Director, Strategic Branding and Global Experience - Boston University School of Hospitality Administration
Read More
Methodology
In order to determine the best staycation spots, WalletHub compared 182 U.S. cities — including the 150 most populated U.S. cities, plus at least two of the most populated cities in each state — across three key dimensions: 1) Recreation, 2) Food & Entertainment and 3) Rest & Relaxation.
We evaluated those dimensions using 41 relevant metrics, which are listed below with their corresponding weights. Each metric was graded on a 100-point scale, with a score of 100 representing the most favorable conditions for staycationers. For metrics marked with an asterisk (*), the square root of the population was used to calculate the “Number of Residents” in order to avoid overcompensating for minor differences across cities.
We then determined each city’s weighted average across all metrics to calculate its overall score and used the resulting scores to rank-order our sample.
Recreation – Total Points: 33.33
- Public Golf Courses per Capita*: Full Weight (~2.30 Points)
- Tennis Courts per Capita*: Full Weight (~2.30 Points)
- Swimming Pools per Capita*: Full Weight (~2.30 Points)
- Basketball Hoops per Capita*: Full Weight (~2.30 Points)
- Baseball & Softball Diamonds per Capita*: Full Weight (~2.30 Points)
- Parks per Capita*: Full Weight (~2.30 Points)
- Playgrounds per Capita*: Full Weight (~2.30 Points)
- Walk Score: Full Weight (~2.30 Points)
- Bike Score: Full Weight (~2.30 Points)
- Bike Rental Facilities per Capita*: Full Weight (~2.30 Points)
- Hiking Trails per Capita*: Full Weight (~2.30 Points)
- Shopping Centers per Capita*: Full Weight (~2.30 Points)
- Water & Amusement Parks per Capita*: Full Weight (~2.30 Points)
- Boat Tours & Water Sports per Capita*: Full Weight (~2.30 Points)
- Miles of Bicycle Lanes, Paths & Routes per Square Mile: Half Weight (~1.15 Points)
Food & Entertainment – Total Points: 33.33
- Movie Costs: Full Weight (~1.71 Points)
- Average Price for Two Tickets to the Theater: Full Weight (~1.71 Points)
- Bowling Costs: Full Weight (~1.71 Points)
- Average Cocktail Price: Full Weight (~1.71 Points)
- Nightlife Options per Capita*: Full Weight (~1.71 Points)
- Casinos per Capita*: Half Weight (~0.85 Points)
- Festivals per Capita*: Full Weight (~1.71 Points)
- Museums per Capita*: Full Weight (~1.71 Points)
- Zoos & Aquariums per Capita*: Full Weight (~1.71 Points)
- Paintball Fields per Capita*: Full Weight (~1.71 Points)
- Arcades per Capita*: Full Weight (~1.71 Points)
- Presence on TripAdvisor’s “Top 25 Amusement Parks or Water Parks” List: Full Weight (~1.71 Points)
Note: This metric measures the presence and prevalence of a city in TripAdvisor’s “Top 25 Amusement Parks or Water Parks” List. - Theaters & Concert Halls per Capita*: Full Weight (~1.71 Points)
- Coffee & Tea Shops per Capita*: Full Weight (~1.71 Points)
- Ice Cream & Frozen Yogurt Shops per Capita*: Full Weight (~1.71 Points)
- Beer Gardens per Capita*: Full Weight (~1.71 Points)
- Restaurants per Capita*: Full Weight (~1.71 Points)
- Restaurant-Meal Costs: Full Weight (~1.71 Points)
- Prevalence of Affordable Restaurants with 4.5+ Stars: Full Weight (~1.71 Points)
- Diversity of Restaurants: Full Weight (~1.71 Points)
Rest & Relaxation – Total Points: 33.33
- Cost of House-Cleaning Service: Full Weight (~5.56 Points)
- Spas & Wellness Centers per Capita*: Full Weight (~5.56 Points)
- Massage Costs: Full Weight (~5.56 Points)
- Beauty-Salon Costs: Full Weight (~5.56 Points)
- Public Beaches per Capita*: Full Weight (~5.56 Points)
- Idealness of Summer Weather: Full Weight (~5.56 Points)
Note: This metric is based on WalletHub’s “Cities with the Best & Worst Weather” ranking.
Sources: Data used to create this ranking were collected as of May 11, 2026 from the U.S. Census Bureau, Council for Community and Economic Research, The Trust for Public Land, League of American Bicyclists, Walk Score, Yelp, TripAdvisor, Expatistan, Numbeo, MassageBook, GolfLink, Areavibes, Thumbtack and WalletHub research.


WalletHub's personal finance experts are frequently cited by leading media outlets. Contact our media team to arrange an interview.