Everyone’s brand of fun is different. Some people like trying new restaurants, traveling, visiting bars and clubs, or playing outdoor sports, for example. Others enjoy things like riding roller coasters, going to the movies or playing video games. But having fun can be expensive – the Bureau of Labor Statistics reports that the average American spends over $3,600 on entertainment annually.
The decision of where to live could save or cost you a lot of money and fun, so it’s fair to wonder what makes a fun city. At WalletHub, we define such a place as one that offers a little bit of everything for everyone — except maybe people seeking the most extreme thrills. In a city with enough variety, you won’t have to compromise with your friends, family, or even yourself about the next fun activity to do alone or together.
To help Americans find the cities with the most significant number and variety of fun yet cost-effective options, WalletHub compared more than 180 U.S. cities based on 65 key metrics. They range from fitness centers per capita to movie costs to the average business hours of breweries.
Top 5 Most Fun Cities
- Las Vegas, NV
- Orlando, FL
- Miami, FL
- Atlanta, GA
- New Orleans, LA
- Most
- T-1. Honolulu, HI
- T-1. Tampa, FL
- T-1. San Francisco, CA
- T-1. New Orleans, LA
- T-1. Miami, FL
- Fewest
- 170. Fargo, ND
- 171. Amarillo, TX
- 172. Port St. Lucie, FL
- 173. Garland, TX
- 174. Laredo, TX
- Most
- T-1. Las Vegas, NV
- T-1. Miami, FL
- T-1. Orlando, FL
- T-1. San Francisco, CA
- T-1. Houston, TX
- Fewest
- 178. North Las Vegas, NV
- 179. West Valley City, UT
- 180. Lewiston, ME
- 181. South Burlington, VT
- 182. Pearl City, HI
- Most
- T-1. Las Vegas, NV
- T-1. New York, NY
- T-1. Chicago, IL
- T-1. Cincinnati, OH
- T-1. Sacramento, CA
- Fewest
- 99. Santa Ana, CA
- 100. Newark, NJ
- 101. Port St. Lucie, FL
- 102. Hialeah, FL
- 103. Gilbert, AZ
- Most
- T-1. Anchorage, AK
- T-1. Chesapeake, VA
- 3. Honolulu, HI
- 4. Jacksonville, FL
- 5. Scottsdale, AZ
- Fewest
- 99. Stockton, CA
- 100. Jersey City, NJ
- 101. Newark, NJ
- 102. Santa Ana, CA
- 103. Hialeah, FL
- Most
- 1. Scottsdale, AZ
- 2. Orlando, FL
- 3. Oakland, CA
- 4. Miami, FL
- 5. Huntington Beach, CA
- Fewest
- 178. Juneau, AK
- 179. Casper, WY
- 180. Bridgeport, CT
- 181. Lewiston, ME
- 182. West Valley City, UT
- Most
- 1. Fort Lauderdale, FL
- 2. Rochester, NY
- 3. Providence, RI
- 4. Wilmington, DE
- 5. Buffalo, NY
- Fewest
- 178. Fremont, CA
- 179. South Burlington, VT
- 180. Garland, TX
- 181. West Valley City, UT
- 182. Moreno Valley, CA
- Most
- T-1. San Francisco, CA
- T-1. Las Vegas, NV
- T-1. Houston, TX
- T-1. Miami, FL
- T-1. New York, NY
- Fewest
- 156. Yonkers, NY
- 157. Moreno Valley, CA
- 158. Fremont, CA
- 159. Garland, TX
- 160. Henderson, NV
- Lowest
- 1. Madison, WI
- 2. Reno, NV
- 3. Milwaukee, WI
- 4. Sioux Falls, SD
- 5. Rapid City, SD
- Highest
- 178. Juneau, AK
- 179. Jersey City, NJ
- 180. Philadelphia, PA
- 181. Salem, OR
- 182. Anchorage, AK
- Lowest
- 1. Corpus Christi, TX
- 2. Amarillo, TX
- 3. Sioux Falls, SD
- 4. Montgomery, AL
- 5. Lubbock, TX
- Highest
- T-178. Honolulu, HI
- T-178. Pearl City, HI
- 180. New York, NY
- T-181. Long Beach, CA
- T-181. Los Angeles, CA
- What tips do you have for having fun while on a budget?
- What should people be looking for when choosing a fun & affordable city?
- What impact does inflation have on visitors to U.S. cities?
- Should cities allow drinking in public--either during certain times or in special designated “Entertainment Districts”--to make their cities more fun?
- What can local authorities do to make their city a more fun destination to visit?
- Number of Attractions: Double Weight (~2.00 Points)
- “TripAdvisor Travelers’ Choice Awards Top 25 Destinations” Ranking: Full Weight (~1.00 Points)
- Coffee & Tea Shops per Capita*: Full Weight (~1.00 Points)
- Restaurants per Capita*: Full Weight (~1.00 Points)
- Diversity of Restaurants: Full Weight (~1.00 Points)
- Ice-Cream & Frozen-Yogurt Shops per Capita*: Full Weight (~1.00 Points)
- Bowling Alleys per Capita*: Full Weight (~1.00 Points)
- Baseball & Softball Diamonds per Capita*: Full Weight (~1.00 Points)
- Basketball Hoops per Capita*: Full Weight (~1.00 Points)
- Tennis Courts per Capita*: Full Weight (~1.00 Points)
- Public & Municipal Golf Courses per Capita*: Full Weight (~1.00 Points)
- Public Swimming Pools per Capita*: Full Weight (~1.00 Points)
- Public Beaches per Capita: Half Weight (~0.50 Points)
- Presence on TripAdvisor’s “Top 25 Beaches” List: Full Weight (~1.00 Points)
- Fishing Facilities per Capita*: Full Weight (~1.00 Points)
- Marinas per Capita*: Full Weight (~1.00 Points)
- Boat Tours & Water Sports per Capita*: Full Weight (~1.00 Points)
- Water & Amusement Parks per Capita*: Full Weight (~1.00 Points)
- Hiking Trails per Capita*: Full Weight (~1.00 Points)
- Scenic and Sightseeing Establishments per Capita*: Full Weight (~1.00 Points)
- Spas & Wellness Centers per Capita*: Full Weight (~1.00 Points)
- Shopping Centers per Capita*: Full Weight (~1.00 Points)
- Share of Population with Walkable Park Access: Full Weight (~1.00 Points)
- Share of Designed Parkland Areas: Full Weight (~1.00 Points)
- Presence on TripAdvisor’s “Top 25 Parks” List: Half Weight (~0.50 Points)
- Playgrounds per Capita*: Full Weight (~1.00 Points)
- Parkland as Share of City Area: Full Weight (~1.00 Points)
- Acres of Parkland per Capita*: Full Weight (~1.00 Points)
- Bike-Rental Facilities per Capita*: Full Weight (~1.00 Points)
- Sports Venues per Capita*: Full Weight (~1.00 Points)
- Fitness Centers per Capita*: Full Weight (~1.00 Points)
- Recreational Sports Centers per Capita*: Full Weight (~1.00 Points)
- Sports Fan-Friendliness: Full Weight (~1.00 Points)
Note: This metric is based on WalletHub’s “Best Sports Cities” ranking, which includes football, basketball, baseball, hockey and soccer. - Movie Theaters per Capita*: Full Weight (~1.00 Points)
- Performing-Arts Theaters per Capita*: Full Weight (~1.00 Points)
- Festivals per Capita*: Full Weight (~1.00 Points)
- Arcades per Capita*: Full Weight (~1.00 Points)
- Amusement Parks per Capita*: Full Weight (~1.00 Points)
- Presence on TripAdvisor’s “Top 20 Amusement & Water Parks” List: Full Weight (~1.00 Points)
- Ideal Weather: Full Weight (~1.00 Points)
Note: This metric is based on WalletHub’s “Cities with the Best & Worst Weather” ranking. - Bar Accessibility: Full Weight (~2.86 Points)
Note: This grade is a combination of bars per capita* (measures availability) and bars per square mile (measures proximity). - Pool Halls per Capita*: Full Weight (~2.86 Points)
- Lounges per Capita*: Full Weight (~2.86 Points)
- Beer Gardens per Capita*: Full Weight (~2.86 Points)
- Legality of Public Drinking: Full Weight (~2.86 Points)
- Time of Last Call: Full Weight (~2.86 Points)
- Average Open Hours of Breweries: Full Weight (~2.86 Points)
- Presence of Music Festivals: Full Weight (~2.86 Points)
Note: The cities that have music festivals will receive 1, the others 0. In case a city has more than one music festival, it will receive the exact number of music festivals. - Music Venues per Capita*: Full Weight (~2.86 Points)
- Dance Clubs per Capita*: Full Weight (~2.86 Points)
- Dance Party Index: Full Weight (~2.86 Points)
- Arts & Crafts-Supplies Establishments per Capita*: Full Weight (~2.86 Points)
- Casinos per Capita*: Full Weight (~2.86 Points)
- Comedy Clubs per Capita*: Full Weight (~2.86 Points)
- Average Price of Party Ticket: Full Weight (~1.67 Points)
- Average Beer Price: Full Weight (~1.67 Points)
Note: This metric measures the price of a six-pack of 12-ounce Heineken containers, excluding any deposit. - Average Wine Price: Full Weight (~1.67 Points)
- Average Food Price (Pizza & Burger): Full Weight (~1.67 Points)
- Prevalence of Affordable Restaurants Rated 4.5+ Stars: Full Weight (~1.67 Points)
- Restaurant-Meal Costs: Full Weight (~1.67 Points)
- Movie Costs: Full Weight (~1.67 Points)
- Bowling Costs: Full Weight (~1.67 Points)
- Average Fitness-Club Fee: Full Weight (~1.67 Points)
- Price for Three-Star Hotel Room: Full Weight (~1.67 Points)
- Cost of Living: Double Weight (~3.33 Points)

Chip Lupo, WalletHub Analyst
Main Findings
Most Fun Cities in America
|
Overall Rank* |
City |
Total Score |
Entertainment & Recreation Rank |
Nightlife & Parties Rank |
Costs Rank |
|---|---|---|---|---|---|
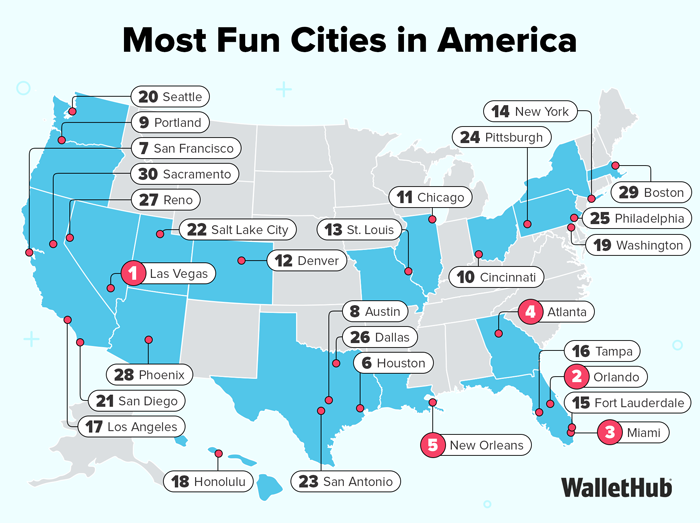
| 1 | Las Vegas, NV | 75.00 | 1 | 1 | 15 |
| 2 | Orlando, FL | 64.88 | 3 | 3 | 72 |
| 3 | Miami, FL | 59.52 | 7 | 2 | 158 |
| 4 | Atlanta, GA | 57.68 | 8 | 7 | 96 |
| 5 | New Orleans, LA | 56.56 | 20 | 4 | 85 |
| 6 | Houston, TX | 54.65 | 21 | 10 | 20 |
| 7 | San Francisco, CA | 54.29 | 4 | 5 | 178 |
| 8 | Austin, TX | 54.21 | 22 | 6 | 82 |
| 9 | Portland, OR | 53.16 | 17 | 9 | 108 |
| 10 | Cincinnati, OH | 52.86 | 14 | 17 | 34 |
| 11 | Chicago, IL | 52.57 | 11 | 12 | 147 |
| 12 | Denver, CO | 52.40 | 15 | 11 | 122 |
| 13 | St. Louis, MO | 52.20 | 18 | 18 | 13 |
| 14 | New York, NY | 51.45 | 5 | 8 | 181 |
| 15 | Fort Lauderdale, FL | 50.86 | 10 | 15 | 160 |
| 16 | Tampa, FL | 50.55 | 9 | 29 | 94 |
| 17 | Los Angeles, CA | 50.18 | 13 | 16 | 148 |
| 18 | Honolulu, HI | 49.68 | 2 | 26 | 176 |
| 19 | Washington, DC | 49.30 | 12 | 14 | 174 |
| 20 | Seattle, WA | 49.21 | 16 | 13 | 168 |
| 21 | San Diego, CA | 48.10 | 6 | 27 | 167 |
| 22 | Salt Lake City, UT | 47.30 | 19 | 25 | 89 |
| 23 | San Antonio, TX | 46.74 | 33 | 24 | 14 |
| 24 | Pittsburgh, PA | 46.09 | 24 | 31 | 92 |
| 25 | Philadelphia, PA | 45.98 | 23 | 20 | 140 |
| 26 | Dallas, TX | 44.70 | 35 | 23 | 99 |
| 27 | Reno, NV | 44.61 | 54 | 21 | 47 |
| 28 | Phoenix, AZ | 44.54 | 28 | 35 | 76 |
| 29 | Boston, MA | 43.96 | 25 | 19 | 175 |
| 30 | Sacramento, CA | 43.84 | 31 | 22 | 130 |
| 31 | Tucson, AZ | 43.33 | 26 | 65 | 42 |
| 32 | Nashville, TN | 43.24 | 40 | 30 | 98 |
| 33 | St. Petersburg, FL | 43.08 | 34 | 49 | 49 |
| 34 | Indianapolis, IN | 43.00 | 60 | 28 | 27 |
| 35 | Richmond, VA | 42.75 | 29 | 36 | 115 |
| 36 | Milwaukee, WI | 42.42 | 43 | 42 | 37 |
| 37 | Kansas City, MO | 42.30 | 66 | 32 | 18 |
| 38 | Minneapolis, MN | 42.28 | 37 | 43 | 93 |
| 39 | Jacksonville, FL | 41.90 | 36 | 47 | 97 |
| 40 | Birmingham, AL | 41.64 | 63 | 45 | 38 |
| 41 | Charleston, SC | 41.62 | 27 | 72 | 100 |
| 42 | Scottsdale, AZ | 41.61 | 32 | 60 | 75 |
| 43 | Charlotte, NC | 41.38 | 50 | 34 | 91 |
| 44 | Louisville, KY | 41.37 | 30 | 56 | 107 |
| 45 | Raleigh, NC | 41.26 | 67 | 40 | 29 |
| 46 | Cleveland, OH | 40.85 | 57 | 48 | 35 |
| 47 | Baton Rouge, LA | 40.49 | 69 | 33 | 71 |
| 48 | Chattanooga, TN | 40.38 | 55 | 50 | 57 |
| 49 | Knoxville, TN | 40.24 | 45 | 67 | 48 |
| 50 | Henderson, NV | 39.85 | 81 | 38 | 31 |
| 51 | Tulsa, OK | 39.85 | 74 | 61 | 6 |
| 52 | Omaha, NE | 39.73 | 42 | 79 | 36 |
| 53 | Buffalo, NY | 39.56 | 59 | 46 | 95 |
| 54 | Tempe, AZ | 39.36 | 49 | 74 | 45 |
| 55 | Columbia, SC | 39.36 | 52 | 71 | 66 |
| 56 | Oklahoma City, OK | 39.21 | 79 | 69 | 1 |
| 57 | Baltimore, MD | 39.07 | 46 | 53 | 112 |
| 58 | Columbus, OH | 38.89 | 48 | 73 | 61 |
| 59 | Rochester, NY | 38.81 | 41 | 54 | 131 |
| 60 | Fort Worth, TX | 38.67 | 83 | 39 | 63 |
| 61 | Albuquerque, NM | 38.63 | 38 | 98 | 56 |
| 62 | El Paso, TX | 38.49 | 68 | 92 | 2 |
| 63 | Portland, ME | 38.32 | 39 | 66 | 134 |
| 64 | Mobile, AL | 37.77 | 95 | 51 | 50 |
| 65 | Detroit, MI | 37.74 | 93 | 52 | 10 |
| 66 | Colorado Springs, CO | 37.63 | 51 | 80 | 81 |
| 67 | Memphis, TN | 37.55 | 85 | 63 | 33 |
| 68 | Grand Rapids, MI | 37.27 | 76 | 75 | 54 |
| 69 | Boise, ID | 37.26 | 61 | 94 | 24 |
| 70 | Providence, RI | 37.24 | 71 | 41 | 141 |
| 71 | Arlington, TX | 36.78 | 87 | 55 | 69 |
| 72 | Tallahassee, FL | 36.58 | 101 | 59 | 78 |
| 73 | Oakland, CA | 36.40 | 73 | 37 | 159 |
| 74 | Wilmington, DE | 36.39 | 78 | 64 | 111 |
| 75 | Wichita, KS | 36.03 | 125 | 76 | 4 |
| 76 | Durham, NC | 35.95 | 110 | 68 | 26 |
| 77 | Madison, WI | 35.71 | 53 | 88 | 113 |
| 78 | Plano, TX | 35.62 | 70 | 89 | 90 |
| 79 | Cape Coral, FL | 35.59 | 86 | 86 | 74 |
| 80 | Lincoln, NE | 35.55 | 80 | 85 | 62 |
| 81 | Gulfport, MS | 35.50 | 147 | 44 | 73 |
| 82 | St. Paul, MN | 35.40 | 62 | 114 | 19 |
| 83 | Long Beach, CA | 35.34 | 56 | 58 | 165 |
| 84 | Overland Park, KS | 35.27 | 115 | 127 | 7 |
| 85 | Huntsville, AL | 35.14 | 128 | 70 | 64 |
| 86 | Virginia Beach, VA | 35.02 | 44 | 117 | 103 |
| 87 | Springfield, MO | 34.87 | 114 | 97 | 8 |
| 88 | North Las Vegas, NV | 34.22 | 123 | 62 | 32 |
| 89 | Shreveport, LA | 34.18 | 134 | 90 | 30 |
| 90 | Winston-Salem, NC | 33.92 | 99 | 105 | 21 |
| 91 | Norfolk, VA | 33.72 | 65 | 119 | 104 |
| 92 | Rapid City, SD | 33.66 | 89 | 108 | 70 |
| 93 | Sioux Falls, SD | 33.60 | 139 | 100 | 22 |
| 94 | Corpus Christi, TX | 33.32 | 98 | 116 | 9 |
| 95 | Greensboro, NC | 33.17 | 105 | 99 | 23 |
| 96 | Fayetteville, NC | 32.95 | 149 | 111 | 3 |
| 97 | Huntington Beach, CA | 32.73 | 75 | 83 | 161 |
| 98 | Pembroke Pines, FL | 32.71 | 96 | 91 | 125 |
| 99 | Bakersfield, CA | 32.69 | 112 | 102 | 55 |
| 100 | Lexington-Fayette, KY | 32.32 | 92 | 113 | 41 |
| 101 | Anchorage, AK | 32.16 | 47 | 154 | 153 |
| 102 | Spokane, WA | 31.97 | 77 | 135 | 77 |
| 103 | Akron, OH | 31.95 | 116 | 109 | 51 |
| 104 | Chandler, AZ | 31.92 | 107 | 126 | 46 |
| 105 | Garden Grove, CA | 31.91 | 94 | 84 | 136 |
| 106 | Anaheim, CA | 31.90 | 82 | 82 | 149 |
| 107 | Glendale, AZ | 31.61 | 100 | 134 | 43 |
| 108 | Irvine, CA | 31.61 | 58 | 125 | 164 |
| 109 | Tacoma, WA | 31.56 | 104 | 96 | 117 |
| 110 | Jackson, MS | 31.55 | 168 | 77 | 106 |
| 111 | Mesa, AZ | 31.46 | 90 | 138 | 53 |
| 112 | Billings, MT | 31.44 | 113 | 104 | 102 |
| 113 | Fort Wayne, IN | 31.36 | 108 | 149 | 16 |
| 114 | Vancouver, WA | 31.17 | 91 | 147 | 88 |
| 115 | Montgomery, AL | 30.90 | 169 | 140 | 12 |
| 116 | Fort Smith, AR | 30.88 | 159 | 118 | 59 |
| 117 | Toledo, OH | 30.87 | 119 | 150 | 11 |
| 118 | San Jose, CA | 30.76 | 64 | 87 | 179 |
| 119 | Hialeah, FL | 30.76 | 121 | 57 | 163 |
| 120 | Aurora, CO | 30.75 | 127 | 106 | 84 |
| 121 | Fargo, ND | 30.72 | 132 | 143 | 60 |
| 122 | Missoula, MT | 30.64 | 84 | 95 | 155 |
| 123 | Burlington, VT | 30.59 | 111 | 78 | 156 |
| 124 | Chesapeake, VA | 30.56 | 102 | 146 | 114 |
| 125 | Charleston, WV | 30.43 | 172 | 158 | 25 |
| 126 | Des Moines, IA | 30.25 | 133 | 123 | 52 |
| 127 | Amarillo, TX | 29.91 | 152 | 166 | 5 |
| 128 | Lubbock, TX | 29.77 | 135 | 142 | 39 |
| 129 | Glendale, CA | 29.75 | 88 | 124 | 137 |
| 130 | Las Cruces, NM | 29.73 | 131 | 170 | 28 |
| 131 | Worcester, MA | 29.45 | 150 | 93 | 127 |
| 132 | Peoria, AZ | 29.34 | 144 | 130 | 105 |
| 133 | Casper, WY | 29.25 | 126 | 173 | 67 |
| 134 | Riverside, CA | 29.11 | 106 | 115 | 123 |
| 135 | Salem, OR | 28.91 | 154 | 81 | 135 |
| 136 | San Bernardino, CA | 28.90 | 166 | 103 | 101 |
| 137 | Little Rock, AR | 28.86 | 148 | 145 | 68 |
| 138 | New Haven, CT | 28.71 | 145 | 128 | 116 |
| 139 | Augusta, GA | 28.62 | 171 | 152 | 40 |
| 140 | Juneau, AK | 28.60 | 72 | 157 | 172 |
| 141 | Huntington, WV | 28.29 | 139 | 137 | 110 |
| 142 | Columbus, GA | 28.27 | 170 | 168 | 17 |
| 143 | Gilbert, AZ | 28.25 | 138 | 153 | 87 |
| 144 | Cedar Rapids, IA | 28.24 | 161 | 120 | 109 |
| 145 | Newark, NJ | 28.16 | 122 | 122 | 138 |
| 146 | Modesto, CA | 27.95 | 129 | 112 | 142 |
| 147 | Newport News, VA | 27.91 | 165 | 133 | 86 |
| 148 | Irving, TX | 27.85 | 157 | 162 | 65 |
| 149 | Garland, TX | 27.80 | 156 | 161 | 44 |
| 150 | Bismarck, ND | 27.80 | 142 | 177 | 78 |
| 151 | Santa Ana, CA | 27.76 | 130 | 101 | 157 |
| 152 | Oceanside, CA | 27.71 | 97 | 151 | 143 |
| 153 | Columbia, MD | 27.38 | 109 | 139 | 151 |
| 154 | Fresno, CA | 27.04 | 117 | 132 | 133 |
| 155 | Santa Clarita, CA | 26.85 | 136 | 141 | 139 |
| 156 | Port St. Lucie, FL | 26.84 | 162 | 107 | 129 |
| 157 | Nampa, ID | 26.57 | 178 | 159 | 83 |
| 158 | Jersey City, NJ | 26.56 | 103 | 121 | 173 |
| 159 | Aurora, IL | 26.17 | 153 | 165 | 119 |
| 160 | Warwick, RI | 25.94 | 124 | 129 | 166 |
| 161 | Manchester, NH | 25.75 | 141 | 110 | 170 |
| 162 | Stockton, CA | 25.73 | 120 | 164 | 124 |
| 163 | Dover, DE | 25.47 | 176 | 172 | 121 |
| 164 | Grand Prairie, TX | 24.77 | 163 | 174 | 126 |
| 165 | Rancho Cucamonga, CA | 24.61 | 151 | 163 | 128 |
| 166 | Fontana, CA | 24.55 | 180 | 160 | 132 |
| 167 | Chula Vista, CA | 24.26 | 160 | 136 | 145 |
| 168 | West Valley City, UT | 24.25 | 167 | 169 | 120 |
| 169 | Cheyenne, WY | 23.86 | 174 | 175 | 118 |
| 170 | Santa Rosa, CA | 23.84 | 118 | 148 | 177 |
| 171 | Laredo, TX | 23.75 | 158 | 180 | 80 |
| 172 | Ontario, CA | 23.74 | 164 | 156 | 146 |
| 173 | Brownsville, TX | 23.00 | 182 | 181 | 58 |
| 174 | Fremont, CA | 22.78 | 137 | 176 | 162 |
| 175 | South Burlington, VT | 22.50 | 146 | 179 | 144 |
| 176 | Moreno Valley, CA | 22.50 | 179 | 144 | 154 |
| 177 | Nashua, NH | 22.44 | 173 | 155 | 169 |
| 178 | Oxnard, CA | 21.75 | 155 | 171 | 152 |
| 179 | Bridgeport, CT | 21.47 | 175 | 167 | 171 |
| 180 | Yonkers, NY | 20.69 | 143 | 131 | 182 |
| 181 | Lewiston, ME | 20.38 | 177 | 182 | 150 |
| 182 | Pearl City, HI | 16.77 | 181 | 178 | 180 |
Notes: *No. 1 = Most Fun
With the exception of “Total Score,” all of the columns in the table above depict the relative rank of that city, where a rank of 1 represents the best conditions for that metric category.


In-Depth Look at the Most Fun Cities
Las Vegas, NV
Las Vegas is the most fun city overall, boasting an extremely large number of attractions and restaurants rated at least 4.5-stars. Some of the venues that are especially prevalent include spas, shopping centers, sports stadiums, festivals and arcades. There are also plenty of things to do for exercise, as Las Vegas has a ton of bowling alleys, basketball courts and hiking trails per capita.
Sin City is known for partying, and it’s one of the only cities in our study where public drinking is allowed in most or all places – whether that’s a good thing or not will depend on your personality, though. When it comes to activities, Vegas unsurprisingly has one of the largest numbers of casinos in the country. But it’s also renowned for its performers, especially when it comes to music. The city has a very high number of music festivals, music venues, dance clubs and comedy clubs relative to others.
Las Vegas certainly isn’t the cheapest city to have fun in, but it’s at least in the middle of the pack when it comes to the cost of activities and food. For some things, it’s even relatively inexpensive – it’s the cheapest city for grabbing a burger, for example, and it has the 12th-cheapest average fitness club membership cost.
Orlando, FL
The second-most fun city in the U.S. is Orlando, FL, which leads the nation in amusement parks, like the iconic Disney World and Universal Studios. While you might expect a stay in Orlando to be especially expensive, the amusement-park markup doesn’t necessarily extend to the rest of the city. For example, Orlando actually has the 11th-lowest nightly rate for a 3-star hotel room, the 19th-lowest average pizza price, and the 53rd-lowest average wine price among the more than 180 cities in our study.
If you’re into sports, Orlando ranks as one of the best cities for soccer fans (5th), and it has a very large number of sports stadiums per capita. And if you want to get in shape yourself, the city has a very high number of fitness centers per capita.
In addition, Orlando ranks as one of the top cities for spas, performing arts theaters, arcades, pool halls and lounges, proving that it has more to experience than just the big tourist traps.
Miami, FL
Miami is the third-most fun city in the U.S., and it’s known for its beaches, which are an especially popular destination for spring-breakers. Miami also leads the country when it comes to the number of fishing facilities, marinas, boat tours and water sports opportunities per capita, and it has the 32nd-most miles of shoreline per capita among the more than 180 cities in our study.
Miami is perfect for staying active, as 89% of its residents live within half a mile of a park, and it has the fourth-most fitness centers per capita. You also can’t talk about Miami without mentioning its famous sports teams, like the Miami Dolphins and Miami Heat, which have helped the city rank as the ninth-best for football fans and sixth-best for basketball fans, respectively. Miami is the 11th-best city for soccer fans, too.
Finally, Miami is one of the best cities when it comes to the availability of affordable restaurants rated at least 4.5 stars, and it has the 10th-most bars per square mile as well as one of the largest numbers of ice cream shops per capita. That’s great for people who want to go out to eat after an activity or beat the Florida heat with a cold treat.
Ask the Experts
Having fun doesn’t have to break the bank. For money-saving ideas and advice to city leaders on attracting fun lovers to their cities, we asked a panel of experts to share their thoughts on the following key questions:
Ask the Experts

Professor and Arlene R. & Robert P. Kogod Eminent Chair in Sustainability, Kogod School of Business | School of Public Affairs - American University
Read More

Ph.D., Professor of Politics, Scholar in Residence - Sacred Heart University
Read More

Professor of Economics at Indiana Wesleyan University
Read More

Ph.D., Professor and Chair of Political Science - University of Central Oklahoma
Read More

Assistant Professor of Government - Hamilton College
Read More

Adjunct Professor of Governance and Technology – Seton Hall University and Town Manager – Town of Hanover, NH
Read More
Methodology
In order to determine the most fun cities in the U.S., WalletHub compared 182 cities — including the 150 most populated U.S. cities, plus at least two of the most populated cities in each state — across three key dimensions: 1) Entertainment & Recreation, 2) Nightlife & Parties and 3) Costs.
We evaluated those dimensions using 65 relevant metrics listed below with their corresponding weights. Each metric was graded on a 100-point scale, with a score of 100 representing the greatest number and variety of fun and cost-effective activities. For metrics marked with an asterisk (*), the square root of the population was used to calculate the population size to avoid overcompensating for minor differences across cities.
Finally, we determined each city’s weighted average across all metrics to calculate its overall score and used the resulting scores to rank-order our sample. Our sample considers only the city proper in each case and excludes the surrounding metro area.
Entertainment & Recreation - Total Points: 40
Nightlife & Parties - Total Points: 40
Costs - Total Points: 20
Sources: Data used to create this ranking were collected as of November 3, 2025 from the U.S. Census Bureau, The Trust for Public Land, Council for Community and Economic Research, Numbeo, Kayak, GolfLink, TripAdvisor, Yelp, Thumbtack, Eventbrite, TheHuffingtonPost.com, Wikipedia, AreaVibes, Music Festival Wizard and WalletHub research.
WalletHub experts are widely quoted. Contact our media team to schedule an interview.