STEM workers are in fierce demand, and not just in the global epicenter of high tech known as Silicon Valley. According to the latest U.S. Bureau of Labor Statistics analysis, STEM — science, technology, engineering and math — professions are expected to grow 8.1% between 2024 and 2034, compared to just 2.7% for all other occupations. In addition, the median annual STEM wage is $103,580, compared to $48,000 for all non-STEM occupations.
Given their growing demand, STEM careers today provide some of the most lucrative employment opportunities. They pay higher salaries and boast far fewer threats of unemployment compared with other types of jobs.
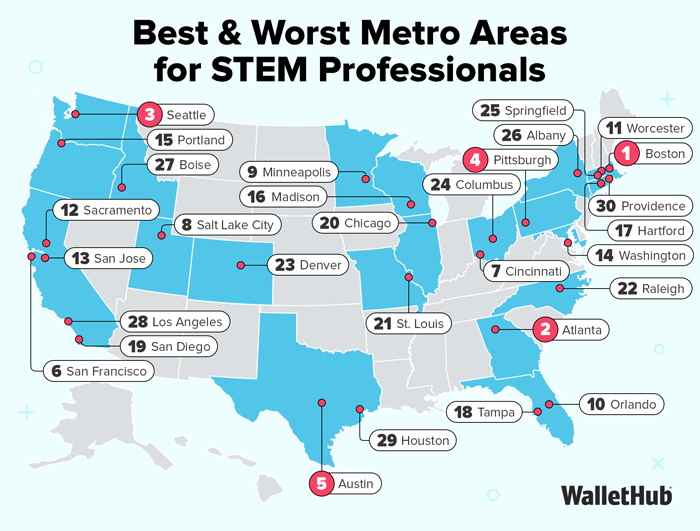
To determine the best markets for STEM professionals, WalletHub compared the 100 largest metro areas across 21 key metrics. Our data set ranges from per-capita job openings for STEM graduates to median wage growth for STEM jobs.

Chip Lupo, WalletHub Analyst
Main Findings
Best Cities for STEM Jobs
| Overall Rank | Metro Area* | Total Score | Professional Opportunities Rank | STEM-Friendliness Rank | Quality of Life Rank |
|---|---|---|---|---|---|
| 1 | Boston, MA | 69.43 | 3 | 1 | 67 |
| 2 | Atlanta, GA | 66.70 | 7 | 12 | 9 |
| 3 | Seattle, WA | 65.42 | 4 | 7 | 35 |
| 4 | Pittsburgh, PA | 65.07 | 24 | 13 | 5 |
| 5 | Austin, TX | 64.78 | 6 | 20 | 10 |
| 6 | San Francisco, CA | 64.26 | 5 | 3 | 61 |
| 7 | Cincinnati, OH | 62.05 | 15 | 33 | 6 |
| 8 | Salt Lake City, UT | 60.77 | 2 | 37 | 23 |
| 9 | Minneapolis, MN | 59.69 | 22 | 24 | 14 |
| 10 | Orlando, FL | 59.61 | 19 | 31 | 11 |
| 11 | Worcester, MA | 58.73 | 40 | 5 | 51 |
| 12 | Sacramento, CA | 58.59 | 55 | 10 | 25 |
| 13 | San Jose, CA | 58.19 | 10 | 6 | 79 |
| 14 | Washington, DC | 58.13 | 1 | 35 | 52 |
| 15 | Portland, OR | 57.48 | 34 | 43 | 7 |
| 16 | Madison, WI | 57.18 | 29 | 26 | 29 |
| 17 | Hartford, CT | 57.14 | 8 | 27 | 16 |
| 18 | Tampa, FL | 56.95 | 25 | 32 | 26 |
| 19 | San Diego, CA | 56.76 | 35 | 9 | 56 |
| 20 | Chicago, IL | 56.73 | 62 | 17 | 17 |
| 21 | St. Louis, MO | 56.35 | 17 | 45 | 24 |
| 22 | Raleigh, NC | 56.16 | 13 | 14 | 62 |
| 23 | Denver, CO | 55.88 | 9 | 23 | 57 |
| 24 | Columbus, OH | 55.53 | 54 | 15 | 30 |
| 25 | Springfield, MA | 54.94 | 98 | 2 | 4 |
| 26 | Albany, NY | 54.32 | 11 | 40 | 13 |
| 27 | Boise, ID | 53.58 | 23 | 76 | 12 |
| 28 | Los Angeles, CA | 52.93 | 76 | 4 | 70 |
| 29 | Houston, TX | 52.54 | 51 | 22 | 42 |
| 30 | Providence, RI | 51.22 | 42 | 29 | 40 |
| 31 | Baltimore, MD | 50.85 | 16 | 11 | 87 |
| 32 | Dallas, TX | 50.71 | 21 | 25 | 71 |
| 33 | Cleveland, OH | 50.68 | 45 | 30 | 53 |
| 34 | Albuquerque, NM | 50.60 | 39 | 74 | 20 |
| 35 | Spokane, WA | 50.41 | 64 | 41 | 28 |
| 36 | Rochester, NY | 50.29 | 49 | 36 | 36 |
| 37 | New York, NY | 49.99 | 48 | 8 | 85 |
| 38 | Harrisburg, PA | 49.91 | 12 | 57 | 15 |
| 39 | Dayton, OH | 49.87 | 20 | 66 | 1 |
| 40 | Nashville, TN | 49.31 | 30 | 19 | 80 |
| 41 | Greenville, SC | 48.68 | 18 | 54 | 18 |
| 42 | Richmond, VA | 48.65 | 14 | 56 | 60 |
| 43 | Des Moines, IA | 48.58 | 27 | 87 | 22 |
| 44 | Tucson, AZ | 48.54 | 68 | 59 | 27 |
| 45 | Buffalo, NY | 48.47 | 56 | 39 | 55 |
| 46 | Columbia, SC | 47.65 | 32 | 55 | 46 |
| 47 | Omaha, NE | 47.49 | 58 | 85 | 21 |
| 48 | Knoxville, TN | 47.11 | 61 | 50 | 33 |
| 49 | Philadelphia, PA | 47.10 | 65 | 21 | 72 |
| 50 | Charleston, SC | 46.31 | 26 | 91 | 34 |
| 51 | New Haven, CT | 46.16 | 79 | 18 | 68 |
| 52 | Phoenix, AZ | 45.72 | 59 | 72 | 39 |
| 53 | San Antonio, TX | 45.54 | 53 | 48 | 63 |
| 54 | Syracuse, NY | 45.50 | 47 | 62 | 3 |
| 55 | Colorado Springs, CO | 45.04 | 33 | 90 | 49 |
| 56 | Milwaukee, WI | 44.72 | 66 | 61 | 54 |
| 57 | Grand Rapids, MI | 44.50 | 46 | 75 | 45 |
| 58 | El Paso, TX | 44.50 | 71 | 67 | 41 |
| 59 | Kansas City, MO | 44.20 | 38 | 95 | 44 |
| 60 | Allentown, PA | 43.76 | 82 | 28 | 48 |
| 61 | Charlotte, NC | 43.64 | 28 | 69 | 74 |
| 62 | Oklahoma City, OK | 43.56 | 60 | 93 | 38 |
| 63 | Virginia Beach, VA | 42.93 | 52 | 71 | 66 |
| 64 | Honolulu, HI | 42.58 | 74 | 94 | 31 |
| 65 | Jacksonville, FL | 41.87 | 57 | 52 | 78 |
| 66 | Miami, FL | 41.71 | 41 | 53 | 82 |
| 67 | Indianapolis, IN | 41.53 | 37 | 46 | 90 |
| 68 | Akron, OH | 41.26 | 69 | 64 | 65 |
| 69 | Bakersfield, CA | 41.05 | 90 | 44 | 69 |
| 70 | Ogden, UT | 40.89 | 44 | 73 | 50 |
| 71 | Provo, UT | 40.85 | 50 | 70 | 43 |
| 72 | Augusta, GA | 40.54 | 36 | 83 | 76 |
| 73 | Tulsa, OK | 40.48 | 77 | 98 | 32 |
| 74 | Las Vegas, NV | 40.34 | 72 | 96 | 47 |
| 75 | Riverside, CA | 39.88 | 99 | 16 | 88 |
| 76 | Birmingham, AL | 39.69 | 43 | 92 | 73 |
| 77 | Wichita, KS | 38.36 | 85 | 51 | 81 |
| 78 | Youngstown, OH | 38.11 | 97 | 60 | 2 |
| 79 | Palm Bay, FL | 38.02 | 31 | 99 | 37 |
| 80 | Toledo, OH | 37.90 | 86 | 63 | 77 |
| 81 | Louisville, KY | 37.73 | 84 | 88 | 64 |
| 82 | Scranton, PA | 37.73 | 89 | 68 | 8 |
| 83 | Detroit, MI | 37.66 | 63 | 78 | 84 |
| 84 | Baton Rouge, LA | 37.29 | 67 | 81 | 83 |
| 85 | Chattanooga, TN | 37.21 | 70 | 80 | 75 |
| 86 | New Orleans, LA | 36.67 | 95 | 89 | 59 |
| 87 | Bridgeport, CT | 36.49 | 75 | 47 | 93 |
| 88 | Lakeland, FL | 36.16 | 87 | 58 | 58 |
| 89 | Fresno, CA | 35.74 | 93 | 42 | 92 |
| 90 | Stockton, CA | 35.51 | 100 | 38 | 89 |
| 91 | Oxnard, CA | 35.08 | 88 | 34 | 99 |
| 92 | Greensboro, NC | 34.91 | 80 | 65 | 91 |
| 93 | Winston-Salem, NC | 34.90 | 81 | 77 | 86 |
| 94 | McAllen, TX | 34.45 | 94 | 79 | 19 |
| 95 | Deltona, FL | 34.08 | 92 | 49 | 94 |
| 96 | Little Rock, AR | 29.43 | 73 | 97 | 95 |
| 97 | Memphis, TN | 29.27 | 83 | 84 | 97 |
| 98 | North Port, FL | 28.01 | 91 | 82 | 100 |
| 99 | Jackson, MS | 27.55 | 78 | 100 | 96 |
| 100 | Cape Coral, FL | 26.49 | 96 | 86 | 98 |
*“Metro Area” is a simplified term for Metropolitan Statistical Area (MSA), which was used for our sample.
Note: With the exception of “Total Score,” all of the columns in the table above depict the relative rank of each metro area, where a rank of 1 represents the best conditions for that category.

- Highest
- 1. San Jose, CA
- 2. San Francisco, CA
- 3. Seattle, WA
- 4. Palm Bay, FL
- 5. Washington, DC
- Lowest
- 96. Fresno, CA
- 97. Riverside, CA
- 98. Stockton, CA
- 99. Youngstown, OH
- 100. McAllen, TX

- Highest
- 1. Providence, RI
- 2. Worcester, MA
- 3. El Paso, TX
- 4. Boise, ID
- 5. Augusta, GA
- Lowest
- 96. St. Louis, MO
- 97. Louisville, KY
- 98. New Orleans, LA
- 99. Youngstown, OH
- 100. Springfield, MA

- Highest
- T-1. Boston, MA
- T-1. Worcester, MA
- T-1. Springfield, MA
- T-4. Salt Lake City, UT
- T-4. Provo, UT
- T-4. Ogden, UT
- Lowest
- T-95. Oklahoma City, OK
- T-95. Tulsa, OK
- 97. Portland, OR
- 98. Little Rock, AR
- 99. Washington, DC
- 100. Albuquerque, NM

- Highest
- 1. San Jose, CA
- 2. San Francisco, CA
- 3. Atlanta, GA
- 4. Austin, TX
- 5. San Diego, CA
- Lowest
- T-67. Grand Rapids, MI
- T-67. Chattanooga, TN
- T-67. Charleston, SC
- T-67. Jackson, MS
- T-67. Bridgeport, CT

- Highest
- 1. Augusta, GA
- 2. Charlotte, NC
- 3. Baltimore, MD
- 4. Des Moines, IA
- 5. Albuquerque, NM
- Lowest
- 96. Stockton, CA
- 97. Cape Coral, FL
- 98. Riverside, CA
- 99. Oxnard, CA
- 100. Honolulu, HI

- Highest
- 1. Augusta, GA
- 2. Miami, FL
- 3. Salt Lake City, UT
- 4. El Paso, TX
- 5. Nashville, TN
- Lowest
- 96. Worcester, MA
- 97. Wichita, KS
- 98. Atlanta, GA
- 99. Minneapolis, MN
- 100. Raleigh, NC

- Highest
- 1. Dayton, OH
- 2. Youngstown, OH
- 3. Albuquerque, NM
- 4. Winston-Salem, NC
- 5. Cincinnati, OH
- Lowest
- 96. Deltona, FL
- 97. North Port, FL
- 98. Oxnard, CA
- 99. Cape Coral, FL
- 100. Honolulu, HI
In-Depth Look at the Best Metro Areas for STEM Professionals
Boston, MA
The Boston metro area is the best place for STEM professionals in 2026 in part because it prioritizes STEM advancement. R&D expenditures make up over 9% of its GDP, the highest percentage in the country. On top of that, Boston has the second-most invention patents per capita.
Boston does a good job teaching STEM fundamentals from a young age, too, ranking at the top of the country when it comes to fourth- and eighth-grade mathematics performance. Those students may also want to stay in the city for college and grad school, as the Boston metro area has six schools that rank in the top 100 engineering universities in the U.S. That’s the most for any metro area.
Finally, STEM employment in Boston makes up over 11% of all jobs, the sixth-highest percentage in the country. Plus, around 12% of job postings on Indeed for the metro area are in tech, the ninth-highest percentage.
Atlanta, GA
The Atlanta, GA, metro area ranks second for STEM professionals, in part because the city has the third-most job openings for STEM graduates per capita and it also ranks among the top cities for gender equity in STEM occupations, with the ninth-smallest disparity between women and men in the field.
People in the Atlanta area can expect high earnings, too. The metro area ranks in the top 10 for median earnings from STEM jobs, at over $110,000 per year, adjusted for the cost of living. Atlanta is also good for tech education – students can find tech-related summer programs, and the area’s engineering universities rank third in the nation. Due to its promising conditions for this field, Atlanta is sometimes referred to as “Silicon Peach.”
To top things off, Atlanta is a great place to live in general, ranking third among the best cities for recreation and the best place for singles.
Seattle, WA
Seattle, one of the most well-known West Coast tech hubs, is the third-best area for STEM, in large part because it has plentiful STEM jobs. For example, the Seattle metro area ranks third in the country for STEM employment, with STEM positions making up nearly 13% of all jobs. In addition, 28.6% of new job postings on Indeed are in tech, the highest percentage in the nation.
STEM jobs in the Seattle metro aren’t just abundant – they also pay well. Seattle has one of the highest average monthly wages for new STEM employees, at nearly $12,000. Moreover, the region’s engineering universities hold the seventh spot nationwide.
Seattle’s economy is deeply tied to STEM innovation, too. Over 8.4% of the Seattle metro area’s GDP stems from research and development, the third-highest share in the country. It also has very productive inventors, with the third-most invention patents per capita.
Ask the Experts
STEM professionals are in high demand and tend to get compensated well for their work, but STEM careers also come with various challenges. For guidance, we asked a panel of experts to share their advice for both job seekers and local governments that stand to benefit from growth in the field. Click on the experts’ profiles to read their bios and responses to the following key questions:
- What is the current outlook for the STEM job market?
- According to recent census figures, the majority of STEM graduates do not ultimately work in a STEM occupation. Why is that the case?
- How can the U.S. stay ahead of other countries in attracting and training the best STEM professionals?
- How can local authorities make their cities more appealing to STEM graduates and technology companies?
- How can the government, employers and educators increase the number of women and minorities in STEM fields?
- How has inflation affected the STEM field in terms of education and employment?
Ask the Experts

Ph.D. – Centennial Commission Professor of Liberal Arts, Department of Sociology and Population Research Center - University of Texas, Austin
Read More

Ph.D. – Associate Professor; Program Coordinator: Education, Equity, and Transformation (EET) Graduate Degree; Research Affiliate: Center for Ethics & Human Rights, School of Education, College of Health and Human Sciences - Colorado State University
Read More

STEM Senior Instructor, STEM/CREATE Path to the MBA, Culverhouse College of Business - University of Alabama
Read More

Ph.D. – Professor, School of Education, Virginia Polytechnic Institute & State University
Read More

DTE – Professor and Co-Director for Engineering Education, Department of STEM Education – North Carolina State University
Read More

Ph.D. – Associate Professor, STEM Transformation Institute; Associate Editor, Journal of Research in Science Teaching – Florida International University
Read More
Methodology
In order to determine the best job markets for STEM professionals, WalletHub compared 100 of the most populated U.S. metropolitan statistical areas (MSAs) — metro areas, for short — across three key dimensions, “Professional Opportunities”, “STEM-Friendliness” and “Quality of Life.”
We evaluated those dimensions using 21 relevant metrics, which are listed below with their corresponding weights. Each metric was graded on a 100-point scale, with a score of 100 representing the most favorable conditions for STEM professionals. Data for metrics marked with an asterisk (*) were available only at the state level.
Finally, we determined each metro area’s weighted average across all metrics to calculate its overall score and used the resulting scores to rank-order our sample.
Professional Opportunities – Total Points: 33.33
- Job Openings for STEM Graduates per Capita: Double Weight (~6.35 Points)
- Share of Job Postings in Tech: Full Weight (~3.17 Points)
Note: This metric measures the share of job postings in tech out of total postings on Indeed.com. - Share of Workforce in STEM: Double Weight (~6.35 Points)
- STEM Employment Growth (2024 vs. 2022): Double Weight (~6.35 Points)
- Unemployment Rate for Adults with at Least a Bachelor’s Degree: Full Weight (~3.17 Points)
Note: “Adults” include the population aged 25 and older. - Annual Median Wage for STEM Workers: Full Weight (~3.17 Points)
Note: This metric was adjusted for the cost of living. - Average Monthly Earnings for New Employees in STEM Industries: Full Weight (~3.17 Points)
- Median Wage Growth for STEM Workers (2024 vs. 2022): Half Weight (~1.59 Points)
STEM-Friendliness – Total Points: 33.33
- Mathematics Performance*: Full Weight (~5.13 Points)
Note: This metric considers standardized math test scores of fourth and eighth graders. - Number of Best Engineering Schools: Full Weight (~5.13 Points)
Note: This metric measures the number of engineering universities in the top 100 of U.S. News & World Report’s “Best Engineering Schools” ranking. - Quality of Engineering Universities: Full Weight (~5.13 Points)
Note: This metric is based on U.S. News & World Report’s “Best Engineering Schools” score. - Disparity of Women vs. Men in STEM Occupations: Half Weight (~2.56 Points)
- Disparity of Women vs. Men in STEM Field of Degree: Half Weight (~2.56 Points)
- Research & Development (R&D) Spending & Intensity*: Full Weight (~5.13 Points)
- Invention Patents per Capita*: Half Weight (~2.56 Points)
Note: “Invention Patents” refers to state-granted invention patents, including utility, design, plant, and reissue patents. - Tech Meetups per Capita: Half Weight (~2.56 Points)
- Presence of Tech Summer Programs: Half Weight (~2.56 Points)
Note: This binary metric considers the presence or absence of Tech Summer Programs in the cities.
Quality of Life – Total Points: 33.33
- Housing Affordability: Full Weight (~8.33 Points)
Note: This metric was calculated as follows: Annual Median Gross Rent / Annual Median Wage for STEM Workers. - Recreation-Friendliness: Full Weight (~8.33 Points)
Note: This metric is based on WalletHub’s “Best & Worst Cities for Recreation” ranking. - Family-Friendliness: Full Weight (~8.33 Points)
Note: This metric is based on WalletHub’s “Best & Worst Places to Raise a Family” ranking. - Singles-Friendliness: Full Weight (~8.33 Points)
Note: This metric is based on WalletHub’s “Best & Worst Cities for Singles” ranking.
Sources: Data used to create this ranking were collected as of December 19, 2025 from the U.S. Census Bureau, Bureau of Labor Statistics, United States Patent and Trademark Office, National Center for Education Statistics, National Science Foundation, Council for Community and Economic Research, Indeed, U.S. News & World Report, Meetup.com, iDTech and WalletHub research.
WalletHub experts are widely quoted. Contact our media team to schedule an interview.