
The total household debt in the United States currently stands at $18.79 trillion. Mortgages represent the bulk of this debt, but other sources—such as student and auto loans, credit cards, and personal loans—also contribute significantly to the national total.
In the first quarter of 2026, there was around $339 billion inflation-adjusted decline in household debt. This reduction was observed across all 182 cities included in the study, indicating an overall positive movement for the economy.
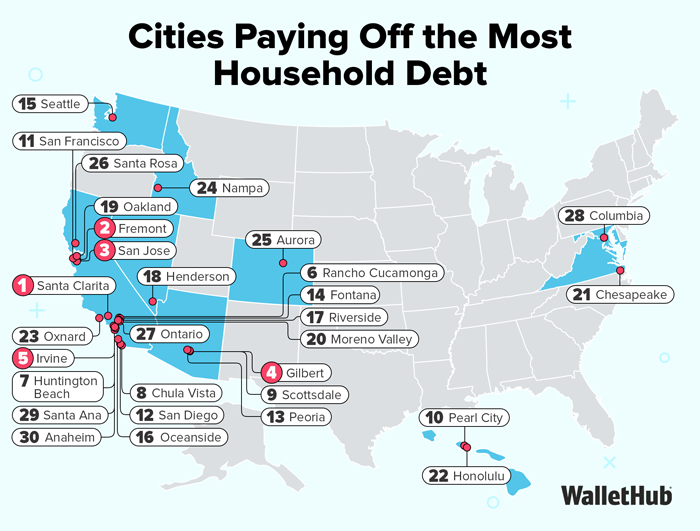
However, the rate of debt decline varies significantly between cities. WalletHub analyzed data from TransUnion and the Federal Reserve to determine where household debt is decreasing most rapidly during Q1 2026.

Chip Lupo, WalletHub Analyst
Main Findings
Household Debt Decreases by City: Q1 2026 vs. Q4 2025
| Overall Rank* | City | Household Debt | Household Debt Decrease | Total Debt | Total Debt Decrease |
|---|---|---|---|---|---|
| 1 | Santa Clarita, CA | $495,675 | -$9,237 | $38,871,040,034 | -$700,217,864 |
| 2 | Fremont, CA | $392,495 | -$7,314 | $31,691,515,540 | -$570,886,842 |
| 3 | San Jose, CA | $334,349 | -$6,230 | $113,635,829,117 | -$2,047,021,058 |
| 4 | Gilbert, AZ | $295,093 | -$5,499 | $29,415,964,744 | -$529,895,366 |
| 5 | Irvine, CA | $294,075 | -$5,480 | $34,099,069,335 | -$614,256,204 |
| 6 | Rancho Cucamonga, CA | $288,540 | -$5,377 | $17,561,233,668 | -$316,345,781 |
| 7 | Huntington Beach, CA | $286,988 | -$5,348 | $23,247,604,316 | -$418,779,323 |
| 8 | Chula Vista, CA | $286,834 | -$5,345 | $25,431,738,922 | -$458,124,040 |
| 9 | Scottsdale, AZ | $283,087 | -$5,275 | $34,741,885,920 | -$625,835,818 |
| 10 | Pearl City, HI | $278,638 | -$5,192 | $4,312,936,664 | -$77,692,681 |
| 11 | San Francisco, CA | $273,959 | -$5,105 | $103,148,983,099 | -$1,858,112,377 |
| 12 | San Diego, CA | $256,525 | -$4,780 | $140,752,815,689 | -$2,535,502,930 |
| 13 | Peoria, AZ | $255,645 | -$4,764 | $19,523,083,568 | -$351,686,290 |
| 14 | Fontana, CA | $255,486 | -$4,761 | $15,424,507,452 | -$277,855,073 |
| 15 | Seattle, WA | $247,516 | -$4,612 | $93,063,999,413 | -$1,676,442,791 |
| 16 | Oceanside, CA | $245,903 | -$4,582 | $15,757,889,124 | -$283,860,567 |
| 17 | Riverside, CA | $243,866 | -$4,544 | $24,009,982,061 | -$432,512,697 |
| 18 | Henderson, NV | $238,996 | -$4,454 | $32,776,233,884 | -$590,426,818 |
| 19 | Oakland, CA | $237,848 | -$4,432 | $43,447,407,103 | -$782,655,945 |
| 20 | Moreno Valley, CA | $236,902 | -$4,415 | $13,617,072,892 | -$245,296,181 |
| 21 | Chesapeake, VA | $235,602 | -$4,390 | $22,818,628,466 | -$411,051,808 |
| 22 | Honolulu, HI | $232,159 | -$4,326 | $32,878,312,509 | -$592,265,649 |
| 23 | Oxnard, CA | $231,701 | -$4,318 | $12,662,108,030 | -$228,093,569 |
| 24 | Nampa, ID | $227,101 | -$4,232 | $9,193,648,247 | -$165,613,185 |
| 25 | Aurora, CO | $226,320 | -$4,217 | $34,019,792,551 | -$612,828,122 |
| 26 | Santa Rosa, CA | $226,055 | -$4,212 | $15,976,507,034 | -$287,798,721 |
| 27 | Ontario, CA | $224,238 | -$4,179 | $12,472,794,067 | -$224,683,291 |
| 28 | Columbia, MD | $222,566 | -$4,147 | $9,472,581,053 | -$170,637,844 |
| 29 | Santa Ana, CA | $221,186 | -$4,122 | $18,549,289,050 | -$334,144,482 |
| 30 | Anaheim, CA | $219,106 | -$4,083 | $24,097,464,981 | -$434,088,603 |
| 31 | Chandler, AZ | $217,707 | -$4,057 | $24,253,441,343 | -$436,898,341 |
| 32 | Glendale, CA | $217,269 | -$4,049 | $16,311,260,876 | -$293,828,934 |
| 33 | Colorado Springs, CO | $217,129 | -$4,046 | $45,487,081,655 | -$819,398,378 |
| 34 | North Las Vegas, NV | $213,367 | -$3,976 | $19,623,947,041 | -$353,503,232 |
| 35 | Port St. Lucie, FL | $212,064 | -$3,952 | $18,416,743,393 | -$331,756,822 |
| 36 | Washington, DC | $207,758 | -$3,871 | $69,738,717,832 | -$1,256,264,200 |
| 37 | Charleston, SC | $206,097 | -$3,841 | $14,503,307,734 | -$261,260,701 |
| 38 | Juneau, AK | $205,832 | -$3,836 | $2,803,584,432 | -$50,503,406 |
| 39 | Virginia Beach, VA | $205,408 | -$3,828 | $38,215,918,580 | -$688,416,591 |
| 40 | Denver, CO | $205,274 | -$3,825 | $71,227,360,920 | -$1,283,080,423 |
| 41 | Garden Grove, CA | $204,607 | -$3,813 | $10,397,075,013 | -$187,291,558 |
| 42 | Boston, MA | $203,235 | -$3,787 | $59,575,997,334 | -$1,073,194,274 |
| 43 | Portland, OR | $202,460 | -$3,773 | $60,674,990,974 | -$1,092,991,402 |
| 44 | Long Beach, CA | $200,769 | -$3,741 | $35,499,484,603 | -$639,483,102 |
| 45 | Cape Coral, FL | $198,961 | -$3,708 | $17,065,132,132 | -$307,409,073 |
| 46 | West Valley City, UT | $198,276 | -$3,695 | $8,125,786,345 | -$146,376,859 |
| 47 | Anchorage, AK | $190,183 | -$3,544 | $21,364,968,146 | -$384,865,760 |
| 48 | Vancouver, WA | $189,541 | -$3,532 | $15,980,729,657 | -$287,874,787 |
| 49 | Reno, NV | $189,136 | -$3,524 | $22,367,476,572 | -$402,924,816 |
| 50 | Tacoma, WA | $188,350 | -$3,510 | $18,126,643,923 | -$326,531,008 |
| 51 | Los Angeles, CA | $187,799 | -$3,500 | $279,574,428,883 | -$5,036,217,430 |
| 52 | Boise, ID | $187,582 | -$3,496 | $19,633,216,620 | -$353,670,213 |
| 53 | New York, NY | $185,672 | -$3,460 | $640,378,540,998 | -$11,535,695,817 |
| 54 | Nashville, TN | $181,482 | -$3,382 | $58,857,694,799 | -$1,060,254,865 |
| 55 | Raleigh, NC | $180,576 | -$3,365 | $38,002,936,439 | -$684,579,958 |
| 56 | Bakersfield, CA | $179,066 | -$3,337 | $24,011,240,191 | -$432,535,360 |
| 57 | Pembroke Pines, FL | $178,718 | -$3,330 | $11,993,864,882 | -$216,055,923 |
| 58 | Salem, OR | $177,182 | -$3,302 | $12,395,568,714 | -$223,292,164 |
| 59 | Las Vegas, NV | $175,112 | -$3,263 | $44,877,495,982 | -$808,417,381 |
| 60 | Austin, TX | $174,571 | -$3,253 | $82,367,964,446 | -$1,483,765,807 |
| 61 | Cheyenne, WY | $174,181 | -$3,246 | $5,268,558,769 | -$94,907,133 |
| 62 | Stockton, CA | $174,055 | -$3,243 | $17,842,025,692 | -$321,403,932 |
| 63 | Spokane, WA | $173,035 | -$3,224 | $17,442,587,007 | -$314,208,496 |
| 64 | Mesa, AZ | $172,649 | -$3,217 | $35,451,423,158 | -$638,617,330 |
| 65 | Overland Park, KS | $170,749 | -$3,182 | $14,989,081,479 | -$270,011,366 |
| 66 | Sacramento, CA | $169,225 | -$3,153 | $35,067,509,474 | -$631,701,558 |
| 67 | Billings, MT | $167,825 | -$3,127 | $8,853,006,116 | -$159,476,902 |
| 68 | Bismarck, ND | $167,699 | -$3,125 | $5,747,337,257 | -$103,531,786 |
| 69 | Glendale, AZ | $164,721 | -$3,070 | $15,102,791,325 | -$272,059,720 |
| 70 | Warwick, RI | $163,360 | -$3,044 | $6,092,910,614 | -$109,756,900 |
| 71 | Phoenix, AZ | $162,248 | -$3,023 | $102,456,063,117 | -$1,845,630,206 |
| 72 | Missoula, MT | $162,111 | -$3,021 | $5,859,521,837 | -$105,552,665 |
| 73 | Charlotte, NC | $162,043 | -$3,020 | $61,819,009,139 | -$1,113,599,597 |
| 74 | Modesto, CA | $160,449 | -$2,990 | $12,114,559,215 | -$218,230,095 |
| 75 | San Bernardino, CA | $158,563 | -$2,955 | $10,530,365,620 | -$189,692,638 |
| 76 | Salt Lake City, UT | $158,092 | -$2,946 | $15,152,328,456 | -$272,952,076 |
| 77 | Atlanta, GA | $157,465 | -$2,934 | $38,518,616,165 | -$693,869,346 |
| 78 | Fresno, CA | $155,356 | -$2,895 | $28,999,980,772 | -$522,401,885 |
| 79 | Rapid City, SD | $155,113 | -$2,890 | $5,193,718,400 | -$93,558,968 |
| 80 | Portland, ME | $154,134 | -$2,872 | $5,256,107,959 | -$94,682,846 |
| 81 | Sioux Falls, SD | $150,570 | -$2,806 | $13,393,963,138 | -$241,277,111 |
| 82 | Knoxville, TN | $148,095 | -$2,760 | $13,215,324,717 | -$238,059,142 |
| 83 | Durham, NC | $148,077 | -$2,759 | $19,384,928,545 | -$349,197,584 |
| 84 | Nashua, NH | $147,780 | -$2,754 | $5,676,776,156 | -$102,260,708 |
| 85 | Plano, TX | $147,206 | -$2,743 | $17,121,921,771 | -$308,432,074 |
| 86 | Burlington, VT | $147,122 | -$2,742 | $2,663,969,980 | -$47,988,409 |
| 87 | Minneapolis, MN | $146,421 | -$2,729 | $29,192,803,119 | -$525,875,362 |
| 88 | Fort Lauderdale, FL | $145,861 | -$2,718 | $12,221,693,038 | -$220,159,990 |
| 89 | Dover, DE | $141,789 | -$2,642 | $2,262,908,586 | -$40,763,741 |
| 90 | St. Petersburg, FL | $141,141 | -$2,630 | $17,410,194,050 | -$313,624,973 |
| 91 | Tampa, FL | $140,550 | -$2,619 | $24,175,750,302 | -$435,498,824 |
| 92 | San Antonio, TX | $140,081 | -$2,610 | $80,363,168,376 | -$1,447,651,672 |
| 93 | Fort Worth, TX | $139,305 | -$2,596 | $49,302,112,612 | -$888,121,850 |
| 94 | St. Paul, MN | $138,575 | -$2,582 | $17,954,472,010 | -$323,429,526 |
| 95 | Casper, WY | $136,660 | -$2,547 | $3,614,108,025 | -$65,104,072 |
| 96 | New Orleans, LA | $136,346 | -$2,541 | $21,977,714,401 | -$395,903,691 |
| 97 | Norfolk, VA | $136,241 | -$2,539 | $13,383,963,554 | -$241,096,980 |
| 98 | Las Cruces, NM | $133,779 | -$2,493 | $6,575,810,130 | -$118,455,789 |
| 99 | Huntsville, AL | $133,694 | -$2,491 | $13,181,482,021 | -$237,449,504 |
| 100 | Columbia, SC | $132,179 | -$2,463 | $7,257,306,454 | -$130,732,175 |
| 101 | Wilmington, DE | $131,153 | -$2,444 | $4,294,720,507 | -$77,364,537 |
| 102 | Fargo, ND | $130,847 | -$2,438 | $8,117,319,453 | -$146,224,338 |
| 103 | Lincoln, NE | $130,405 | -$2,430 | $16,541,638,095 | -$297,978,919 |
| 104 | Aurora, IL | $129,832 | -$2,419 | $8,235,227,661 | -$148,348,321 |
| 105 | Jacksonville, FL | $129,708 | -$2,417 | $52,915,754,928 | -$953,217,533 |
| 106 | Albuquerque, NM | $128,960 | -$2,403 | $32,514,844,691 | -$585,718,187 |
| 107 | Tucson, AZ | $127,235 | -$2,371 | $30,011,936,902 | -$540,631,131 |
| 108 | Manchester, NH | $126,906 | -$2,365 | $6,453,931,581 | -$116,260,285 |
| 109 | Omaha, NE | $126,589 | -$2,359 | $26,412,571,390 | -$475,792,629 |
| 110 | Tallahassee, FL | $126,532 | -$2,358 | $11,166,594,918 | -$201,153,590 |
| 111 | Baton Rouge, LA | $125,024 | -$2,330 | $11,407,803,235 | -$205,498,685 |
| 112 | Chicago, IL | $124,976 | -$2,329 | $149,994,760,408 | -$2,701,986,121 |
| 113 | Lexington-Fayette, KY | $123,460 | -$2,301 | $17,843,615,014 | -$321,432,562 |
| 114 | Grand Rapids, MI | $123,441 | -$2,300 | $10,243,958,902 | -$184,533,344 |
| 115 | Providence, RI | $122,010 | -$2,274 | $9,023,942,197 | -$162,556,122 |
| 116 | Dallas, TX | $121,963 | -$2,273 | $67,362,096,263 | -$1,213,452,048 |
| 117 | Fayetteville, NC | $119,328 | -$2,224 | $10,207,170,692 | -$183,870,646 |
| 118 | Richmond, VA | $119,017 | -$2,218 | $12,843,786,293 | -$231,366,297 |
| 119 | Miami, FL | $118,814 | -$2,214 | $23,945,230,199 | -$431,346,265 |
| 120 | Lubbock, TX | $118,778 | -$2,213 | $13,157,754,269 | -$237,022,075 |
| 121 | Yonkers, NY | $118,538 | -$2,209 | $10,011,535,145 | -$180,346,493 |
| 122 | Worcester, MA | $118,463 | -$2,208 | $9,742,434,905 | -$175,498,956 |
| 123 | Corpus Christi, TX | $117,471 | -$2,189 | $14,429,253,126 | -$259,926,691 |
| 124 | Pittsburgh, PA | $117,281 | -$2,185 | $16,765,315,541 | -$302,008,215 |
| 125 | Madison, WI | $116,497 | -$2,171 | $15,456,924,106 | -$278,439,022 |
| 126 | Orlando, FL | $115,694 | -$2,156 | $15,699,668,892 | -$282,811,795 |
| 127 | Little Rock, AR | $115,172 | -$2,146 | $10,467,519,154 | -$188,560,530 |
| 128 | Grand Prairie, TX | $113,659 | -$2,118 | $8,042,909,353 | -$144,883,924 |
| 129 | Winston-Salem, NC | $113,522 | -$2,115 | $12,102,492,969 | -$218,012,736 |
| 130 | Fort Wayne, IN | $113,445 | -$2,114 | $13,018,012,288 | -$234,504,782 |
| 131 | Newport News, VA | $111,832 | -$2,084 | $8,805,047,103 | -$158,612,974 |
| 132 | Tempe, AZ | $111,046 | -$2,069 | $8,992,109,031 | -$161,982,684 |
| 133 | Kansas City, MO | $110,969 | -$2,068 | $25,481,652,083 | -$459,023,169 |
| 134 | Hialeah, FL | $110,687 | -$2,063 | $8,821,667,583 | -$158,912,373 |
| 135 | Gulfport, MS | $109,885 | -$2,048 | $3,329,115,413 | -$59,970,252 |
| 136 | Greensboro, NC | $108,638 | -$2,024 | $13,933,476,695 | -$250,995,838 |
| 137 | Louisville, KY | $108,600 | -$2,024 | $29,715,031,629 | -$535,282,718 |
| 138 | Jersey City, NJ | $108,061 | -$2,014 | $13,998,086,715 | -$252,159,715 |
| 139 | El Paso, TX | $107,693 | -$2,007 | $27,332,468,467 | -$492,363,535 |
| 140 | Chattanooga, TN | $107,137 | -$1,996 | $8,764,829,590 | -$157,888,501 |
| 141 | Arlington, TX | $106,493 | -$1,984 | $15,693,255,181 | -$282,696,259 |
| 142 | Amarillo, TX | $105,716 | -$1,970 | $8,720,424,825 | -$157,088,600 |
| 143 | Cincinnati, OH | $105,443 | -$1,965 | $15,739,363,574 | -$283,526,850 |
| 144 | St. Louis, MO | $105,044 | -$1,957 | $15,744,375,285 | -$283,617,130 |
| 145 | Garland, TX | $104,811 | -$1,953 | $8,885,709,034 | -$160,066,008 |
| 146 | Cedar Rapids, IA | $104,357 | -$1,945 | $6,407,123,963 | -$115,417,098 |
| 147 | Mobile, AL | $101,402 | -$1,890 | $8,878,313,508 | -$159,932,786 |
| 148 | Indianapolis, IN | $100,658 | -$1,876 | $37,794,046,409 | -$680,817,040 |
| 149 | Houston, TX | $100,415 | -$1,871 | $96,645,995,706 | -$1,740,968,407 |
| 150 | Wichita, KS | $99,971 | -$1,863 | $16,400,670,071 | -$295,439,539 |
| 151 | Baltimore, MD | $98,374 | -$1,833 | $26,017,793,692 | -$468,681,154 |
| 152 | Philadelphia, PA | $98,350 | -$1,833 | $69,124,424,240 | -$1,245,198,395 |
| 153 | Laredo, TX | $97,938 | -$1,825 | $7,910,720,676 | -$142,502,694 |
| 154 | Shreveport, LA | $96,429 | -$1,797 | $7,580,712,573 | -$136,557,971 |
| 155 | Rutland, VT | $96,261 | -$1,794 | $738,273,263 | -$13,299,159 |
| 156 | Columbus, OH | $95,935 | -$1,788 | $38,756,458,964 | -$698,153,815 |
| 157 | Springfield, MO | $94,139 | -$1,754 | $7,676,138,896 | -$138,276,969 |
| 158 | Charleston, WV | $92,885 | -$1,731 | $2,028,955,884 | -$36,549,348 |
| 159 | Fort Smith, AR | $91,164 | -$1,699 | $3,468,071,059 | -$62,473,381 |
| 160 | Birmingham, AL | $90,841 | -$1,693 | $8,343,513,973 | -$150,298,976 |
| 161 | Tulsa, OK | $90,033 | -$1,678 | $16,104,065,299 | -$290,096,539 |
| 162 | Augusta, GA | $89,885 | -$1,675 | $6,994,331,693 | -$125,994,982 |
| 163 | Oklahoma City, OK | $87,629 | -$1,633 | $25,387,455,260 | -$457,326,320 |
| 164 | Montgomery, AL | $86,503 | -$1,612 | $7,269,726,550 | -$130,955,909 |
| 165 | Columbus, GA | $84,611 | -$1,577 | $7,125,978,389 | -$128,366,449 |
| 166 | Brownsville, TX | $84,016 | -$1,566 | $5,200,663,098 | -$93,684,069 |
| 167 | Bridgeport, CT | $83,752 | -$1,561 | $4,900,063,190 | -$88,269,102 |
| 168 | Lewiston, ME | $82,704 | -$1,541 | $1,377,338,687 | -$24,811,200 |
| 169 | Irving, TX | $81,352 | -$1,516 | $7,981,695,011 | -$143,781,217 |
| 170 | Huntington, WV | $79,199 | -$1,476 | $1,618,337,975 | -$29,152,530 |
| 171 | Rochester, NY | $78,841 | -$1,469 | $7,606,134,700 | -$137,015,922 |
| 172 | Milwaukee, WI | $73,778 | -$1,375 | $17,746,049,246 | -$319,675,025 |
| 173 | Buffalo, NY | $73,757 | -$1,374 | $9,127,564,256 | -$164,422,756 |
| 174 | Akron, OH | $73,572 | -$1,371 | $6,448,882,322 | -$116,169,328 |
| 175 | New Haven, CT | $72,599 | -$1,353 | $4,113,508,971 | -$74,100,216 |
| 176 | Memphis, TN | $70,589 | -$1,315 | $18,483,213,960 | -$332,954,214 |
| 177 | Jackson, MS | $68,551 | -$1,277 | $4,355,152,663 | -$78,453,154 |
| 178 | Newark, NJ | $63,019 | -$1,174 | $7,391,598,344 | -$133,151,292 |
| 179 | Toledo, OH | $60,356 | -$1,125 | $7,408,707,083 | -$133,459,487 |
| 180 | Cleveland, OH | $54,258 | -$1,011 | $9,523,881,091 | -$171,561,956 |
| 181 | Detroit, MI | $42,657 | -$795 | $11,384,712,293 | -$205,082,728 |
| 182 | Des Moines, IA | $2,738 | -$51 | $255,205,810 | -$4,597,244 |
Note: *No. 1 = Largest Household Debt Decrease
Methodology
To determine the cities with the largest and smallest decreases in household debt from Q4 2025 to Q1 2026, we analyzed the latest data on consumers’ finances from TransUnion as well as the Federal Reserve. All numbers are adjusted by inflation to March 2026.
Sources: Data used to create this ranking were collected as of May 12, 2026 from the U.S. Census Bureau, TransUnion and the Federal Reserve.


WalletHub's personal finance experts are frequently cited by leading media outlets. Contact our media team to arrange an interview.