Hunger, poverty and homelessness affect every nation — even the richest and most powerful. In 2024, 10.6% of the U.S. population lived in poverty. As we continue to deal with the economic fallout of inflation, it’s important to help our existing impoverished population and ensure we minimize the number of new people who fall into poverty.
On the heels of our report on the most charitable states, WalletHub compared more than 180 U.S. cities based on 28 key indicators of economic disadvantage, such as child poverty, food insecurity and uninsured rates.

Chip Lupo, WalletHub Analyst
Main Findings
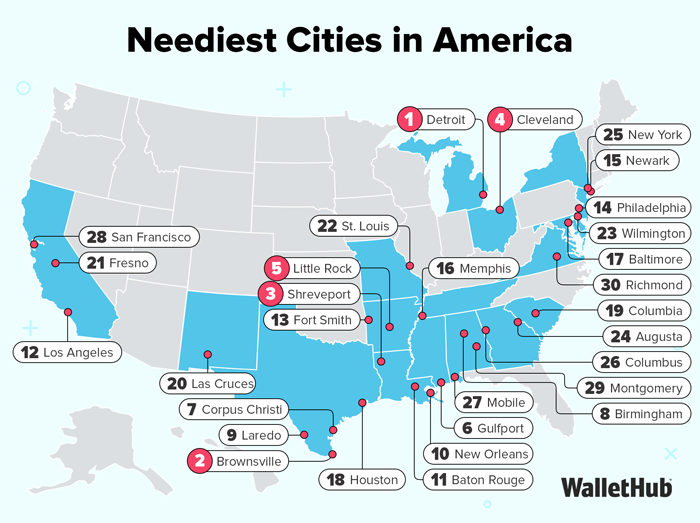
Neediest Cities in America
| Overall Rank* | City | Total Score | Economic Well-Being Rank | Health & Safety Rank |
|---|---|---|---|---|
| 1 | Detroit, MI | 59.90 | 1 | 7 |
| 2 | Brownsville, TX | 56.40 | 7 | 3 |
| 3 | Shreveport, LA | 55.43 | 9 | 5 |
| 4 | Cleveland, OH | 54.39 | 4 | 16 |
| 5 | Little Rock, AR | 53.87 | 17 | 6 |
| 6 | Gulfport, MS | 53.52 | 13 | 15 |
| 7 | Corpus Christi, TX | 52.32 | 45 | 2 |
| 8 | Birmingham, AL | 52.13 | 23 | 11 |
| 9 | Laredo, TX | 52.05 | 24 | 13 |
| 10 | New Orleans, LA | 51.82 | 14 | 26 |
| 11 | Baton Rouge, LA | 51.65 | 8 | 41 |
| 12 | Los Angeles, CA | 51.03 | 28 | 17 |
| 13 | Fort Smith, AR | 50.84 | 82 | 1 |
| 14 | Philadelphia, PA | 50.75 | 5 | 81 |
| 15 | Newark, NJ | 50.43 | 16 | 53 |
| 16 | Memphis, TN | 50.26 | 43 | 8 |
| 17 | Baltimore, MD | 49.93 | 11 | 78 |
| 18 | Houston, TX | 49.63 | 60 | 4 |
| 19 | Columbia, SC | 49.51 | 2 | 122 |
| 20 | Las Cruces, NM | 49.39 | 33 | 30 |
| 21 | Fresno, CA | 49.25 | 25 | 45 |
| 22 | St. Louis, MO | 49.11 | 38 | 23 |
| 23 | Wilmington, DE | 49.08 | 15 | 84 |
| 24 | Augusta, GA | 49.05 | 26 | 52 |
| 25 | New York, NY | 48.89 | 10 | 99 |
| 26 | Columbus, GA | 48.85 | 29 | 43 |
| 27 | Mobile, AL | 48.74 | 34 | 35 |
| 28 | San Francisco, CA | 48.41 | 52 | 14 |
| 29 | Montgomery, AL | 48.31 | 18 | 91 |
| 30 | Richmond, VA | 48.25 | 12 | 104 |
| 31 | Jackson, MS | 48.25 | 21 | 82 |
| 32 | Indianapolis, IN | 48.18 | 20 | 88 |
| 33 | Chicago, IL | 48.09 | 6 | 125 |
| 34 | Chattanooga, TN | 47.87 | 62 | 19 |
| 35 | Toledo, OH | 47.81 | 30 | 72 |
| 36 | New Haven, CT | 47.74 | 3 | 139 |
| 37 | Las Vegas, NV | 47.64 | 37 | 51 |
| 38 | San Antonio, TX | 47.62 | 56 | 18 |
| 39 | Tulsa, OK | 47.45 | 72 | 9 |
| 40 | North Las Vegas, NV | 47.38 | 35 | 70 |
| 41 | Lubbock, TX | 47.20 | 46 | 42 |
| 42 | Newport News, VA | 46.99 | 61 | 27 |
| 43 | Albuquerque, NM | 46.85 | 53 | 32 |
| 44 | San Bernardino, CA | 46.66 | 49 | 40 |
| 45 | Fayetteville, NC | 46.63 | 40 | 73 |
| 46 | Stockton, CA | 46.58 | 31 | 93 |
| 47 | Cincinnati, OH | 46.36 | 47 | 57 |
| 48 | Dallas, TX | 46.28 | 71 | 20 |
| 49 | Hialeah, FL | 46.13 | 68 | 24 |
| 50 | Long Beach, CA | 46.11 | 39 | 85 |
| 51 | Rochester, NY | 46.03 | 36 | 97 |
| 52 | Bakersfield, CA | 46.02 | 48 | 60 |
| 53 | Miami, FL | 45.98 | 55 | 48 |
| 54 | El Paso, TX | 45.90 | 63 | 34 |
| 55 | Denver, CO | 45.86 | 64 | 33 |
| 56 | Norfolk, VA | 45.86 | 27 | 114 |
| 57 | Akron, OH | 45.84 | 50 | 68 |
| 58 | Tucson, AZ | 45.81 | 54 | 50 |
| 59 | Atlanta, GA | 45.72 | 32 | 106 |
| 60 | Dover, DE | 45.65 | 19 | 128 |
| 61 | Rapid City, SD | 45.21 | 99 | 21 |
| 62 | Honolulu, HI | 45.08 | 65 | 49 |
| 63 | Amarillo, TX | 44.77 | 80 | 25 |
| 64 | Oklahoma City, OK | 44.25 | 78 | 44 |
| 65 | Milwaukee, WI | 44.17 | 57 | 89 |
| 66 | Huntington, WV | 44.17 | 58 | 90 |
| 67 | Glendale, AZ | 44.08 | 81 | 39 |
| 68 | Portland, OR | 44.01 | 77 | 58 |
| 69 | Buffalo, NY | 43.92 | 51 | 101 |
| 70 | Oakland, CA | 43.72 | 67 | 74 |
| 71 | Reno, NV | 43.72 | 123 | 12 |
| 72 | Lewiston, ME | 43.66 | 98 | 38 |
| 73 | Bridgeport, CT | 43.65 | 42 | 127 |
| 74 | Providence, RI | 43.48 | 22 | 155 |
| 75 | Phoenix, AZ | 43.32 | 84 | 59 |
| 76 | Oxnard, CA | 43.31 | 70 | 79 |
| 77 | Kansas City, MO | 43.28 | 89 | 54 |
| 78 | Aurora, CO | 43.25 | 59 | 100 |
| 79 | Tallahassee, FL | 43.22 | 87 | 61 |
| 80 | Springfield, MO | 43.01 | 132 | 10 |
| 81 | Salem, OR | 42.77 | 96 | 76 |
| 82 | Greensboro, NC | 42.75 | 66 | 96 |
| 83 | Washington, DC | 42.64 | 41 | 145 |
| 84 | Irving, TX | 42.50 | 126 | 22 |
| 85 | Wichita, KS | 41.83 | 108 | 56 |
| 86 | Winston-Salem, NC | 41.82 | 68 | 109 |
| 87 | Boston, MA | 41.74 | 44 | 152 |
| 88 | Grand Prairie, TX | 41.71 | 106 | 66 |
| 89 | Spokane, WA | 41.50 | 131 | 29 |
| 90 | Jacksonville, FL | 41.49 | 95 | 92 |
| 91 | Garland, TX | 41.49 | 104 | 77 |
| 92 | Arlington, TX | 41.26 | 130 | 37 |
| 93 | Nashville, TN | 41.18 | 114 | 67 |
| 94 | Anchorage, AK | 41.13 | 120 | 55 |
| 95 | Sacramento, CA | 40.87 | 74 | 123 |
| 96 | Fort Wayne, IN | 40.80 | 75 | 129 |
| 97 | Tacoma, WA | 40.74 | 140 | 31 |
| 98 | Fort Worth, TX | 40.73 | 119 | 64 |
| 99 | Louisville, KY | 40.72 | 83 | 115 |
| 100 | Fort Lauderdale, FL | 40.70 | 76 | 130 |
| 101 | Modesto, CA | 40.69 | 73 | 131 |
| 102 | St. Paul, MN | 40.66 | 85 | 113 |
| 103 | Anaheim, CA | 40.65 | 137 | 36 |
| 104 | Orlando, FL | 40.61 | 94 | 105 |
| 105 | Knoxville, TN | 40.47 | 122 | 71 |
| 106 | Santa Clarita, CA | 40.42 | 90 | 112 |
| 107 | Columbus, OH | 39.99 | 86 | 126 |
| 108 | Ontario, CA | 39.82 | 101 | 110 |
| 109 | Charleston, WV | 39.81 | 134 | 63 |
| 110 | Santa Ana, CA | 39.77 | 136 | 62 |
| 111 | Riverside, CA | 39.28 | 111 | 108 |
| 112 | West Valley City, UT | 39.25 | 147 | 65 |
| 113 | Henderson, NV | 39.22 | 88 | 137 |
| 114 | Minneapolis, MN | 39.21 | 93 | 134 |
| 115 | Grand Rapids, MI | 39.17 | 109 | 111 |
| 116 | Austin, TX | 39.08 | 125 | 94 |
| 117 | St. Petersburg, FL | 39.07 | 133 | 87 |
| 118 | Vancouver, WA | 39.03 | 154 | 47 |
| 119 | Nampa, ID | 38.90 | 100 | 132 |
| 120 | Glendale, CA | 38.71 | 138 | 86 |
| 121 | Tempe, AZ | 38.70 | 121 | 102 |
| 122 | Moreno Valley, CA | 38.65 | 79 | 156 |
| 123 | Salt Lake City, UT | 38.62 | 166 | 28 |
| 124 | Burlington, VT | 38.57 | 113 | 117 |
| 125 | Missoula, MT | 38.49 | 167 | 46 |
| 126 | Worcester, MA | 38.33 | 91 | 151 |
| 127 | Mesa, AZ | 38.24 | 118 | 116 |
| 128 | Charlotte, NC | 38.23 | 105 | 133 |
| 129 | Tampa, FL | 38.23 | 112 | 124 |
| 130 | Manchester, NH | 38.12 | 97 | 147 |
| 131 | Cheyenne, WY | 38.08 | 151 | 83 |
| 132 | Seattle, WA | 37.98 | 149 | 80 |
| 133 | Casper, WY | 37.97 | 163 | 69 |
| 134 | Des Moines, IA | 37.97 | 103 | 140 |
| 135 | Billings, MT | 37.78 | 165 | 75 |
| 136 | Lexington-Fayette, KY | 37.74 | 102 | 143 |
| 137 | Garden Grove, CA | 37.62 | 145 | 95 |
| 138 | Omaha, NE | 37.51 | 129 | 118 |
| 139 | Fontana, CA | 37.41 | 116 | 138 |
| 140 | Santa Rosa, CA | 37.40 | 128 | 119 |
| 141 | Jersey City, NJ | 37.40 | 110 | 144 |
| 142 | Colorado Springs, CO | 37.32 | 141 | 103 |
| 143 | Charleston, SC | 37.25 | 92 | 163 |
| 144 | Pittsburgh, PA | 37.19 | 107 | 148 |
| 145 | Yonkers, NY | 36.97 | 124 | 135 |
| 146 | Port St. Lucie, FL | 36.80 | 135 | 121 |
| 147 | Portland, ME | 36.43 | 148 | 120 |
| 148 | Cape Coral, FL | 35.78 | 115 | 160 |
| 149 | Huntsville, AL | 35.53 | 117 | 162 |
| 150 | Boise, ID | 35.44 | 162 | 107 |
| 151 | Juneau, AK | 35.00 | 177 | 98 |
| 152 | Pembroke Pines, FL | 34.28 | 159 | 136 |
| 153 | Rancho Cucamonga, CA | 34.22 | 155 | 141 |
| 154 | Peoria, AZ | 33.96 | 153 | 149 |
| 155 | Durham, NC | 33.88 | 152 | 150 |
| 156 | San Diego, CA | 33.73 | 143 | 157 |
| 157 | San Jose, CA | 33.65 | 144 | 158 |
| 158 | Chula Vista, CA | 33.44 | 139 | 167 |
| 159 | Chesapeake, VA | 33.13 | 146 | 166 |
| 160 | Lincoln, NE | 33.04 | 157 | 154 |
| 161 | Cedar Rapids, IA | 32.99 | 127 | 179 |
| 162 | Oceanside, CA | 32.76 | 150 | 165 |
| 163 | Aurora, IL | 32.76 | 142 | 175 |
| 164 | Sioux Falls, SD | 32.38 | 169 | 153 |
| 165 | Scottsdale, AZ | 32.25 | 160 | 159 |
| 166 | Plano, TX | 32.21 | 175 | 146 |
| 167 | Raleigh, NC | 32.09 | 156 | 169 |
| 168 | Chandler, AZ | 32.03 | 161 | 161 |
| 169 | Warwick, RI | 31.63 | 158 | 174 |
| 170 | Virginia Beach, VA | 31.01 | 164 | 172 |
| 171 | Gilbert, AZ | 30.93 | 170 | 164 |
| 172 | Nashua, NH | 30.91 | 178 | 142 |
| 173 | Fargo, ND | 30.24 | 168 | 177 |
| 174 | Madison, WI | 30.13 | 171 | 170 |
| 175 | Irvine, CA | 29.58 | 172 | 173 |
| 176 | South Burlington, VT | 29.21 | 173 | 178 |
| 177 | Pearl City, HI | 29.18 | 179 | 168 |
| 178 | Huntington Beach, CA | 28.87 | 176 | 176 |
| 179 | Fremont, CA | 28.05 | 174 | 181 |
| 180 | Bismarck, ND | 27.51 | 180 | 180 |
| 181 | Columbia, MD | 24.79 | 181 | 182 |
| 182 | Overland Park, KS | 24.75 | 182 | 171 |
Notes: *No. 1 = Neediest
With the exception of “Total Score,” all of the columns in the table above depict the relative rank of each city, where a rank of 1 represents the worst conditions for that category.

- Highest
- 1. Cleveland, OH
- 2. Detroit, MI
- 3. Wilmington, DE
- 4. Rochester, NY
- 5. Birmingham, AL
- Lowest
- 178. Pembroke Pines, FL
- 179. Warwick, RI
- 180. Gilbert, AZ
- 181. Fremont, CA
- 182. Overland Park, KS

- Highest
- 1. Detroit, MI
- 2. Cleveland, OH
- 3. Huntington, WV
- 4. Burlington, VT
- 5. Buffalo, NY
- Lowest
- 178. Plano, TX
- 179. Pearl City, HI
- 180. Fremont, CA
- 181. Overland Park, KS
- 182. Gilbert, AZ

- Highest
- T-1. New York, NY
- T-1. Honolulu, HI
- 3. San Francisco, CA
- 4. Portland, OR
- 5. Boston, MA
- Lowest
- 138. Bridgeport, CT
- 139. Houston, TX
- 140. Virginia Beach, VA
- 141. Overland Park, KS
- 142. Columbia, MD

- Highest
- T-1. Brownsville, TX
- T-1. Laredo, TX
- T-1. Garland, TX
- 4. Houston, TX
- 5. Dallas, TX
- Lowest
- T-177. Warwick, RI
- T-177. Washington, DC
- T-179. Boston, MA
- T-179. Pearl City, HI
- 181. Fremont, CA
- 182. South Burlington, VT

- Highest
- 1. Brownsville, TX
- 2. Laredo, TX
- 3. Fort Smith, AR
- 4. Corpus Christi, TX
- 5. El Paso, TX
- Lowest
- 178. Aurora, IL
- 179. San Jose, CA
- 180. Fargo, ND
- 181. Bridgeport, CT
- 182. Bismarck, ND

- Highest
- T-1. San Francisco, CA
- T-1. Newport News, VA
- 3. Detroit, MI
- T-4. Birmingham, AL
- T-4. Hialeah, FL
- Lowest
- T-165. Chandler, AZ
- T-165. Charleston, SC
- T-165. Fayetteville, NC
- T-181. Huntington Beach, CA
- T-181. South Burlington, VT

- Highest
- T-1. San Francisco, CA
- T-1. Glendale, CA
- T-1. Garden Grove, CA
- T-1. Anaheim, CA
- T-1. Lewiston, ME
- Lowest
- T-173. Chandler, AZ
- T-173. Charleston, SC
- T-173. Chula Vista, CA
- 181. Fayetteville, NC
- 182. South Burlington, VT
In-Depth Look at the Neediest Cities
Detroit, MI
Detroit is the neediest city in America, in large part because it has the highest unemployment rate in the nation, at 9.1%. Motown also has the highest adult poverty rate and the second-highest child poverty rate in the country, with more than a quarter of the city’s adults and close to half of its children living below the poverty line. That’s more than double the national average for both child and adult poverty rates.
Detroit’s needs aren’t all financial, though. Safety is a big concern, too, as the city has the third-highest violent crime rate in the nation and the 24th-highest property crime rate. It’s worth noting that a high crime rate can be a symptom of a high poverty rate, so helping lift people out of poverty may improve the crime rate as well.
On top of those issues, Detroit’s housing situation is far from ideal for many people. The city has the third-highest share of households lacking complete plumbing facilities and the 10th-highest share lacking complete kitchen facilities. It has the fifth-highest share of households without a computer and the seventh-highest share without a broadband internet connection, too.
Brownsville, TX
The second-neediest city in America is Brownsville, TX, and one of the biggest contributing factors is that it lags behind other cities when it comes to education. Over 29% of the population ages 25+ never graduated high school, the fourth-highest percentage in the country. Residents also lack the means to get easy access to continued education online, as the city ranks first when it comes to households lacking a computer and seventh for lacking a broadband internet connection.
Brownsville leads the nation when it comes to the share of residents without health insurance coverage, at nearly 29%. It has the highest food insecurity rate, too, at almost 23%. That’s a deadly combination, as going without food can create medical issues that leave people with the choice to either skip the doctor or pay heavily without insurance.
In addition, Brownsville has the 15th-highest adult poverty rate and the 16th-highest child poverty rate, along with the 15th-highest unemployment rate. This has forced many people to live in cramped conditions to avoid homelessness, as the city has the 11th-highest share of housing units that are severely overcrowded.
Shreveport, LA
Shreveport, LA, is the third-neediest city, and one contributing factor is that it had a 27% increase in homelessness between 2023 and 2024, the 35th-highest. The city also has the 19th-highest poverty rate in the nation for adults and the 20th-highest for children, at around 21% and 32%, respectively.
Some people in Shreveport aren’t even able to buy essentials. The city has the 10th-highest food insecurity rate in the country, which is further reflected by the fact that nearly 62% of children enrolled in public schools qualify to receive free or reduced-price lunch.
To top things off, Shreveport has the fourth-highest share of households without a computer and the fifth-highest share without a broadband internet connection. Also, its residents have unaddressed mental health needs, as the city has the 16th-highest suicide rate among the more than 180 cities in our study.
Ask the Experts
We asked a panel of experts to share their insight and advice to help us better understand the changes and challenges experienced by groups in need and those who desire to help. Click on the experts’ profiles to read their bios and responses to the following key questions:
- How has the composition of people in need (age, race, gender, etc.) changed in recent decades?
- What are the main challenges facing low-income families today?
- Which policy interventions have proven successful in helping families achieve economic independence? Which ones have failed?
- How can charities and nonprofits most effectively serve the poor?
- What should be the main focus of local authorities when outlining a strategy to help people in need in the high inflation context?
Ask the Experts

MSW, Ph.D., Professor & BSW Program Director – Department of Social Work, Executive Director – Shady Rest Institute on Positive Aging - Florida Gulf Coast University
Read More

Ph.D., MPA Director, Professor, Political Science/Public Administration - University of Central Oklahoma
Read More

Ph.D. – Professor / Fulbright Scholar, Nonprofit Management, School of Community Leadership and Development – Grand Valley State University
Read More

MNO, CFRE – College Lecturer in Organizational Leadership, Maxine Goodman Levin School of Urban Affairs – Cleveland State University
Read More

Assistant Professor of Public Policy and Economics at the Frank Batten School of Leadership and Public Policy – University of Virginia
Read More
Methodology
In order to determine the cities with the neediest populations, WalletHub compared 182 cities — including the 150 most populated U.S. cities, plus at least two of the most populated cities in each state — across two key dimensions, “Economic Well-Being” and “Health & Safety.”
We evaluated those dimensions using 28 relevant metrics, which are listed below with their corresponding weights. Each metric was graded on a 100-point scale, with a score of 100 representing the highest level of economic disadvantage. Data for metrics marked with an asterisk (*) were available at the state level only.
Finally, we determined each city’s weighted average across all metrics to calculate its overall score and used the resulting scores to rank-order our sample. In determining our sample, we considered only the city proper in each case and excluded cities in the surrounding metro area.
Economic Well-Being - Total Points: 60
- Child Poverty Rate: Triple Weight (~7.83 Points)
- Adult Poverty Rate: Triple Weight (~7.83 Points)
- Unemployment Rate: Full Weight (~2.61 Points)
- Underemployment Rate: Full Weight (~2.61 Points)
- Homelessness Rate: Triple Weight (~7.83 Points)
Note: This metric measures the number of homeless persons per 1,000 residents. - Presence of Homeless Criminalization Laws: Full Weight (~2.61 Points)
Note: This binary metric considers the presence or absence of such legislation. - Change in Family Homelessness (2024 vs 2023): Full Weight (~2.61 Points)
- Well-Being Index: Full Weight (~2.61 Points)
Note: This metric refers to the Sharecare Community Well-Being Index Score. - Consumer Bankruptcy Rate: Half Weight (~1.30 Points)
Note: This metric measures the number of nonbusiness bankruptcy filings per capita. - Foreclosure Rate: Full Weight (~2.61 Points)
- Share of Owner-Occupied Housing Units Spending at Least 35% of Their Household Income on Housing: Full Weight (~2.61 Points)
- Share of Delinquent Debtors: Full Weight (~2.61 Points)
- Median Credit Score: Full Weight (~2.61 Points)
- High School Dropout Rate: Full Weight (~2.61 Points)
- Undereducated Rate: Full Weight (~2.61 Points)
Note: This metric measures the share of population aged 25 and over who did not graduate from high school. - Share of Children Eligible for Free or Reduced-Price Lunch: Full Weight (~2.61 Points)
- “Economic Security” Ranking: Half* Weight (~1.30 Points)
Note: This metric measures the state’s policy potential to improve the economic security of workers, families and retirees and is based on the Economic Security Scorecard produced by the WOW (Wider Opportunities for Women) nonprofit organization. - Economic Mobility: Full Weight (~2.61 Points)
Health & Safety - Total Points: 40
- Uninsured Rate: Full Weight (~3.64 Points)
Note: This metric measures the share of residents without health insurance coverage. - Food Insecurity Rate: Double Weight (~7.27 Points)
- Share of Homes with Inadequate Plumbing: Full Weight (~3.64 Points)
Note: This metric measures the share of occupied housing units without complete plumbing facilities. - Share of Homes with Inadequate Kitchens: Full Weight (~3.64 Points)
Note: This metric measures the share of occupied housing units without complete kitchen facilities. - Share of Severely Overcrowded Homes: Full Weight (~3.64 Points)
Note: This metric measures the share of occupied housing units that are considered “severely overcrowded,” meaning more than 1.5 persons occupy each room. - Share of Offline Homes: Full Weight (~3.64 Points)
Note: This metric measures the share of households lacking a computer and broadband Internet service. - Share of Adults Who Needed to See a Doctor but Couldn’t: Full Weight (~3.64 Points)
Note: This metric refers to the share of adults who needed to see a doctor in the past year, but couldn’t because of costs. - Share of Depressed Adults: Full Weight (~3.64 Points)
Note: This metric measures the share of adults who were diagnosed with depression. - Suicide Rate: Full Weight (~3.64 Points)
- Crime Rate: Full Weight (~3.64 Points)
Sources: Data used to create this ranking were collected as of November 17, 2025 from the U.S. Census Bureau, Bureau of Labor Statistics, Federal Bureau of Investigation, Centers for Disease Control and Prevention, U.S. Department of Housing & Urban Development, Chmura Economics & Analytics, County Health Rankings, National Law Center on Homelessness & Poverty, National Alliance to End Homelessness, Administrative Office of the U.S. Courts, Equality of Opportunity Project, Feeding America, Wider Opportunities for Women, ATTOM, a property data provider - U.S. Foreclosure Market Report, Sharecare Community Well-Being Index and TransUnion.
WalletHub experts are widely quoted. Contact our media team to schedule an interview.