

Las Vegas isn’t the only “Sin City” in America. In other cities, bad things happen and stay there, too. From beer-loving Milwaukee to decadent New Orleans, the U.S. is filled with people behaving illicitly. No place is innocent - we all have flaws, and at some point, we all have to pay for our vices. Gambling addiction, for instance, leads to over $100 billion in losses for U.S. consumers every year, while smoking burns an over $600 billion hole in Uncle Sam’s wallet annually.
Luckily for the saints among us, all American sins are not created or distributed equally. To identify the darkest corners of America, WalletHub compared more than 180 U.S. cities across 37 key indicators of vices and illicit behavior. Our data set ranges from violent crimes per capita to excessive drinking and adult entertainment establishments per capita.

Chip Lupo, WalletHub Analyst
Main Findings
Most Sinful Cities in America
| Overall Rank* | City | WalletHub Vice Index | Anger & Hatred Rank | Jealousy Rank | Excesses & Vices Rank | Greed Rank | Lust Rank | Vanity Rank | Laziness Rank |
|---|---|---|---|---|---|---|---|---|---|
| 1 | Las Vegas, NV | 61.94 | 33 | 11 | 67 | 1 | 3 | 7 | 3 |
| 2 | Houston, TX | 58.30 | 19 | 5 | 133 | 24 | 1 | 6 | 125 |
| 3 | Los Angeles, CA | 54.93 | 24 | 33 | 164 | 95 | 4 | 1 | 67 |
| 4 | Philadelphia, PA | 54.11 | 2 | 7 | 61 | 66 | 12 | 18 | 64 |
| 5 | Atlanta, GA | 52.87 | 27 | 2 | 117 | 168 | 2 | 9 | 92 |
| 6 | Denver, CO | 52.62 | 9 | 40 | 44 | 40 | 9 | 15 | 117 |
| 7 | Miami, FL | 52.29 | 134 | 8 | 153 | 74 | 8 | 4 | 25 |
| 8 | Dallas, TX | 51.48 | 40 | 10 | 108 | 99 | 7 | 10 | 114 |
| 9 | Phoenix, AZ | 51.27 | 65 | 82 | 63 | 67 | 6 | 5 | 53 |
| 10 | New Orleans, LA | 50.71 | 5 | 9 | 13 | 49 | 29 | 82 | 28 |
| 11 | Baton Rouge, LA | 50.61 | 3 | 3 | 9 | 125 | 77 | 45 | 17 |
| 12 | Chicago, IL | 50.04 | 23 | 35 | 123 | 73 | 16 | 8 | 107 |
| 13 | St. Louis, MO | 49.89 | 8 | 21 | 2 | 52 | 40 | 44 | 99 |
| 14 | Cleveland, OH | 49.88 | 6 | 27 | 8 | 138 | 24 | 32 | 10 |
| 15 | Memphis, TN | 49.79 | 7 | 6 | 7 | 117 | 22 | 124 | 22 |
| 16 | Orlando, FL | 49.52 | 13 | 4 | 118 | 161 | 15 | 14 | 134 |
| 17 | New York, NY | 49.42 | 47 | 81 | 174 | 97 | 5 | 3 | 31 |
| 18 | North Las Vegas, NV | 49.12 | 158 | 15 | 43 | 1 | 98 | 21 | 1 |
| 19 | Baltimore, MD | 47.43 | 4 | 19 | 21 | 170 | 10 | 65 | 96 |
| 20 | Nashville, TN | 46.35 | 18 | 76 | 14 | 91 | 27 | 27 | 84 |
| 21 | Henderson, NV | 45.84 | 78 | 16 | 141 | 1 | 114 | 69 | 19 |
| 22 | Birmingham, AL | 45.79 | 10 | 20 | 3 | 147 | 73 | 72 | 106 |
| 23 | Detroit, MI | 45.75 | 12 | 23 | 10 | 153 | 19 | 157 | 4 |
| 24 | Portland, OR | 45.17 | 37 | 49 | 73 | 26 | 14 | 40 | 177 |
| 25 | San Antonio, TX | 44.80 | 109 | 29 | 97 | 46 | 20 | 26 | 65 |
| 26 | Shreveport, LA | 44.66 | 32 | 22 | 12 | 98 | 59 | 92 | 14 |
| 27 | Tampa, FL | 44.34 | 119 | 52 | 95 | 96 | 11 | 17 | 105 |
| 28 | Little Rock, AR | 44.05 | 28 | 18 | 17 | 169 | 35 | 94 | 18 |
| 29 | Fort Lauderdale, FL | 43.80 | 39 | 1 | 152 | 93 | 121 | 58 | 58 |
| 30 | Jacksonville, FL | 43.67 | 44 | 46 | 48 | 156 | 31 | 29 | 33 |
| 31 | Richmond, VA | 43.54 | 25 | 66 | 20 | 124 | 48 | 46 | 75 |
| 32 | Indianapolis, IN | 43.45 | 31 | 56 | 25 | 160 | 17 | 42 | 103 |
| 33 | San Diego, CA | 43.43 | 145 | 123 | 163 | 72 | 33 | 2 | 130 |
| 34 | Charlotte, NC | 43.35 | 99 | 32 | 100 | 106 | 28 | 23 | 63 |
| 35 | Washington, DC | 43.26 | 1 | 26 | 74 | 81 | 36 | 78 | 181 |
| 36 | Cincinnati, OH | 43.06 | 77 | 96 | 5 | 110 | 51 | 25 | 59 |
| 37 | Austin, TX | 43.04 | 137 | 68 | 151 | 33 | 18 | 13 | 172 |
| 38 | Mobile, AL | 42.92 | 63 | 88 | 11 | 80 | 25 | 62 | 49 |
| 39 | Wichita, KS | 42.86 | 38 | 105 | 28 | 59 | 42 | 36 | 70 |
| 40 | Pittsburgh, PA | 42.73 | 52 | 122 | 46 | 63 | 79 | 11 | 168 |
| 41 | San Bernardino, CA | 42.55 | 20 | 69 | 33 | 34 | 101 | 151 | 12 |
| 42 | San Francisco, CA | 42.52 | 62 | 37 | 142 | 104 | 49 | 20 | 121 |
| 43 | Kansas City, MO | 42.48 | 14 | 73 | 27 | 107 | 45 | 57 | 160 |
| 44 | Sacramento, CA | 42.29 | 41 | 98 | 99 | 38 | 84 | 34 | 51 |
| 45 | Tempe, AZ | 42.07 | 26 | 53 | 82 | 144 | 87 | 33 | 45 |
| 46 | Wilmington, DE | 42.03 | 69 | 12 | 53 | 54 | 169 | 70 | 112 |
| 47 | Minneapolis, MN | 42.00 | 81 | 77 | 127 | 23 | 38 | 22 | 175 |
| 48 | Knoxville, TN | 41.87 | 55 | 152 | 1 | 150 | 109 | 16 | 95 |
| 49 | Reno, NV | 41.45 | 85 | 142 | 62 | 9 | 56 | 61 | 94 |
| 50 | Chattanooga, TN | 41.19 | 15 | 75 | 15 | 123 | 95 | 84 | 129 |
| 51 | Rapid City, SD | 40.83 | 48 | 147 | 104 | 16 | 13 | 129 | 61 |
| 52 | Billings, MT | 40.62 | 50 | 146 | 59 | 8 | 105 | 87 | 97 |
| 53 | Gulfport, MS | 40.50 | 94 | 89 | 49 | 15 | 43 | 150 | 85 |
| 54 | Columbus, OH | 40.46 | 46 | 94 | 45 | 151 | 41 | 41 | 110 |
| 55 | Jackson, MS | 40.33 | 49 | 44 | 32 | 22 | 116 | 168 | 20 |
| 56 | Akron, OH | 40.31 | 34 | 109 | 18 | 165 | 39 | 71 | 42 |
| 57 | Bakersfield, CA | 40.26 | 57 | 106 | 35 | 137 | 67 | 38 | 54 |
| 58 | Toledo, OH | 40.25 | 53 | 140 | 4 | 152 | 32 | 108 | 5 |
| 59 | Montgomery, AL | 40.23 | 64 | 17 | 42 | 174 | 26 | 139 | 34 |
| 60 | Tucson, AZ | 40.19 | 76 | 93 | 30 | 141 | 60 | 47 | 23 |
| 61 | Tacoma, WA | 40.05 | 11 | 43 | 41 | 134 | 136 | 112 | 123 |
| 62 | Fort Worth, TX | 40.05 | 126 | 25 | 94 | 143 | 68 | 28 | 111 |
| 63 | Scottsdale, AZ | 39.97 | 106 | 92 | 166 | 55 | 93 | 12 | 147 |
| 64 | Dover, DE | 39.95 | 68 | 24 | 83 | 109 | 153 | 107 | 83 |
| 65 | Colorado Springs, CO | 39.86 | 16 | 91 | 86 | 113 | 91 | 66 | 119 |
| 66 | Fort Smith, AR | 39.74 | 42 | 148 | 37 | 78 | 21 | 123 | 26 |
| 67 | Charleston, SC | 39.72 | 60 | 58 | 60 | 84 | 108 | 30 | 170 |
| 68 | Vancouver, WA | 39.68 | 43 | 87 | 70 | 79 | 118 | 43 | 150 |
| 69 | Long Beach, CA | 39.65 | 104 | 30 | 135 | 27 | 129 | 79 | 69 |
| 70 | Louisville, KY | 39.57 | 51 | 118 | 34 | 159 | 50 | 31 | 89 |
| 71 | Columbia, SC | 39.54 | 82 | 54 | 31 | 88 | 103 | 76 | 56 |
| 72 | Seattle, WA | 39.54 | 71 | 59 | 167 | 70 | 30 | 24 | 178 |
| 73 | Albuquerque, NM | 39.38 | 35 | 84 | 50 | 142 | 94 | 80 | 36 |
| 74 | Charleston, WV | 39.15 | 22 | 137 | 23 | 71 | 74 | 95 | 115 |
| 75 | Aurora, CO | 38.90 | 75 | 85 | 36 | 10 | 138 | 135 | 68 |
| 76 | Milwaukee, WI | 38.85 | 29 | 116 | 24 | 101 | 65 | 109 | 141 |
| 77 | Oklahoma City, OK | 38.38 | 72 | 136 | 69 | 164 | 44 | 37 | 32 |
| 78 | Glendale, AZ | 38.28 | 110 | 72 | 26 | 102 | 100 | 100 | 35 |
| 79 | Buffalo, NY | 38.25 | 61 | 104 | 55 | 132 | 102 | 98 | 16 |
| 80 | Fayetteville, NC | 38.20 | 74 | 60 | 29 | 130 | 61 | 118 | 118 |
| 81 | Omaha, NE | 38.17 | 100 | 127 | 81 | 82 | 66 | 54 | 27 |
| 82 | Huntington, WV | 37.93 | 54 | 167 | 6 | 136 | 104 | 86 | 7 |
| 83 | Corpus Christi, TX | 37.92 | 36 | 144 | 56 | 69 | 46 | 145 | 66 |
| 84 | Salem, OR | 37.90 | 58 | 154 | 90 | 17 | 122 | 85 | 50 |
| 85 | Salt Lake City, UT | 37.55 | 30 | 63 | 161 | 163 | 47 | 39 | 173 |
| 86 | Cheyenne, WY | 37.37 | 45 | 129 | 103 | 103 | 53 | 122 | 44 |
| 87 | Riverside, CA | 37.23 | 136 | 70 | 54 | 128 | 147 | 60 | 41 |
| 88 | Missoula, MT | 37.21 | 88 | 134 | 88 | 5 | 151 | 128 | 145 |
| 89 | St. Petersburg, FL | 37.17 | 122 | 36 | 85 | 157 | 117 | 77 | 76 |
| 90 | Arlington, TX | 36.99 | 138 | 28 | 93 | 41 | 133 | 131 | 104 |
| 91 | Rochester, NY | 36.94 | 89 | 57 | 47 | 155 | 125 | 48 | 149 |
| 92 | Springfield, MO | 36.87 | 56 | 125 | 19 | 177 | 63 | 50 | 77 |
| 93 | Huntington Beach, CA | 36.72 | 165 | 51 | 175 | 27 | 166 | 19 | 159 |
| 94 | El Paso, TX | 36.61 | 90 | 161 | 84 | 47 | 23 | 120 | 135 |
| 95 | Fresno, CA | 36.32 | 84 | 115 | 92 | 90 | 82 | 88 | 91 |
| 96 | Oakland, CA | 36.26 | 17 | 37 | 171 | 92 | 177 | 147 | 137 |
| 97 | Spokane, WA | 36.25 | 105 | 67 | 66 | 115 | 113 | 116 | 113 |
| 98 | Anchorage, AK | 36.25 | 21 | 159 | 111 | 86 | 90 | 102 | 101 |
| 99 | Boston, MA | 36.21 | 97 | 102 | 137 | 39 | 78 | 52 | 164 |
| 100 | Santa Clarita, CA | 36.17 | 147 | 71 | 154 | 27 | 139 | 67 | 124 |
| 101 | Tulsa, OK | 36.01 | 87 | 114 | 52 | 175 | 71 | 56 | 47 |
| 102 | Grand Prairie, TX | 35.96 | 168 | 48 | 101 | 41 | 64 | 165 | 80 |
| 103 | Gilbert, AZ | 35.93 | 118 | 131 | 126 | 129 | 81 | 35 | 102 |
| 104 | Hialeah, FL | 35.84 | 178 | 13 | 162 | 100 | 107 | 143 | 9 |
| 105 | Santa Ana, CA | 35.81 | 98 | 50 | 107 | 27 | 175 | 146 | 74 |
| 106 | Garland, TX | 35.79 | 125 | 34 | 138 | 112 | 80 | 166 | 72 |
| 107 | Augusta, GA | 35.63 | 116 | 42 | 16 | 179 | 57 | 133 | 46 |
| 108 | Lubbock, TX | 35.50 | 101 | 78 | 22 | 145 | 62 | 117 | 176 |
| 109 | Newark, NJ | 35.45 | 148 | 90 | 115 | 45 | 135 | 174 | 2 |
| 110 | Ontario, CA | 35.36 | 115 | 103 | 77 | 34 | 140 | 160 | 24 |
| 111 | Irving, TX | 35.30 | 170 | 31 | 149 | 114 | 83 | 148 | 52 |
| 112 | Glendale, CA | 35.25 | 150 | 45 | 168 | 85 | 149 | 89 | 86 |
| 113 | Mesa, AZ | 35.20 | 121 | 107 | 71 | 148 | 111 | 73 | 60 |
| 114 | Des Moines, IA | 35.19 | 70 | 153 | 51 | 105 | 92 | 99 | 88 |
| 115 | Stockton, CA | 35.18 | 66 | 107 | 105 | 83 | 110 | 144 | 55 |
| 116 | Anaheim, CA | 35.05 | 108 | 41 | 144 | 119 | 111 | 140 | 109 |
| 117 | Las Cruces, NM | 35.03 | 135 | 74 | 96 | 133 | 55 | 167 | 21 |
| 118 | Columbus, GA | 34.87 | 86 | 62 | 72 | 181 | 58 | 130 | 39 |
| 119 | Raleigh, NC | 34.86 | 113 | 99 | 139 | 77 | 128 | 63 | 140 |
| 120 | Chandler, AZ | 34.81 | 156 | 117 | 122 | 87 | 127 | 49 | 108 |
| 121 | Providence, RI | 34.79 | 177 | 141 | 88 | 6 | 76 | 169 | 15 |
| 122 | Norfolk, VA | 34.64 | 114 | 61 | 38 | 60 | 97 | 156 | 174 |
| 123 | Rancho Cucamonga, CA | 34.50 | 141 | 110 | 157 | 34 | 106 | 115 | 81 |
| 124 | Oceanside, CA | 34.41 | 112 | 126 | 120 | 89 | 146 | 81 | 120 |
| 125 | Juneau, AK | 34.31 | 59 | 133 | 125 | 31 | 141 | 119 | 138 |
| 126 | Newport News, VA | 34.26 | 83 | 100 | 102 | 60 | 86 | 161 | 132 |
| 127 | St. Paul, MN | 34.20 | 123 | 149 | 119 | 32 | 126 | 90 | 165 |
| 128 | Greensboro, NC | 34.06 | 95 | 79 | 68 | 158 | 130 | 101 | 142 |
| 129 | Pembroke Pines, FL | 34.01 | 179 | 14 | 165 | 93 | 142 | 158 | 43 |
| 130 | Casper, WY | 33.38 | 67 | 182 | 91 | 120 | 37 | 155 | 6 |
| 131 | Nampa, ID | 33.35 | 103 | 180 | 124 | 53 | 96 | 97 | 13 |
| 132 | Jersey City, NJ | 33.23 | 128 | 113 | 177 | 4 | 158 | 162 | 38 |
| 133 | Modesto, CA | 33.18 | 91 | 165 | 79 | 127 | 85 | 110 | 133 |
| 134 | Sioux Falls, SD | 33.10 | 111 | 173 | 121 | 21 | 115 | 111 | 143 |
| 135 | Warwick, RI | 33.07 | 182 | 158 | 106 | 6 | 181 | 103 | 48 |
| 136 | Fontana, CA | 32.99 | 163 | 130 | 87 | 34 | 145 | 153 | 30 |
| 137 | Lewiston, ME | 32.66 | 144 | 178 | 65 | 14 | 174 | 163 | 8 |
| 138 | Manchester, NH | 32.58 | 80 | 169 | 146 | 48 | 170 | 113 | 71 |
| 139 | Grand Rapids, MI | 32.55 | 79 | 156 | 64 | 180 | 88 | 51 | 62 |
| 140 | Oxnard, CA | 32.40 | 127 | 160 | 76 | 75 | 155 | 127 | 73 |
| 141 | Plano, TX | 32.40 | 107 | 47 | 176 | 135 | 171 | 106 | 158 |
| 142 | New Haven, CT | 32.22 | 155 | 83 | 116 | 58 | 150 | 173 | 29 |
| 143 | Cedar Rapids, IA | 32.19 | 133 | 166 | 58 | 131 | 131 | 74 | 127 |
| 144 | Winston-Salem, NC | 32.18 | 93 | 138 | 40 | 171 | 120 | 132 | 87 |
| 145 | Amarillo, TX | 32.18 | 96 | 135 | 78 | 167 | 54 | 136 | 153 |
| 146 | Tallahassee, FL | 32.04 | 73 | 55 | 80 | 182 | 152 | 105 | 154 |
| 147 | Durham, NC | 32.02 | 149 | 86 | 109 | 20 | 172 | 152 | 146 |
| 148 | Moreno Valley, CA | 31.98 | 160 | 112 | 75 | 126 | 134 | 180 | 37 |
| 149 | Peoria, AZ | 31.81 | 140 | 120 | 113 | 122 | 132 | 137 | 126 |
| 150 | Bismarck, ND | 31.74 | 92 | 171 | 134 | 146 | 72 | 83 | 144 |
| 151 | Santa Rosa, CA | 31.73 | 102 | 177 | 160 | 13 | 176 | 59 | 136 |
| 152 | Fargo, ND | 31.65 | 153 | 139 | 156 | 25 | 137 | 138 | 161 |
| 153 | Aurora, IL | 31.50 | 167 | 101 | 131 | 65 | 164 | 181 | 82 |
| 154 | Lincoln, NE | 31.47 | 130 | 170 | 130 | 50 | 124 | 104 | 79 |
| 155 | Garden Grove, CA | 31.33 | 146 | 65 | 159 | 108 | 163 | 175 | 78 |
| 156 | Lexington-Fayette, KY | 31.29 | 143 | 145 | 39 | 176 | 75 | 91 | 162 |
| 157 | Worcester, MA | 31.27 | 161 | 155 | 112 | 12 | 168 | 134 | 122 |
| 158 | Yonkers, NY | 31.23 | 166 | 119 | 173 | 116 | 178 | 68 | 57 |
| 159 | Fort Wayne, IN | 30.99 | 131 | 164 | 57 | 178 | 70 | 55 | 98 |
| 160 | Burlington, VT | 30.97 | 151 | 80 | 143 | 43 | 162 | 177 | 152 |
| 161 | Chula Vista, CA | 30.95 | 159 | 143 | 145 | 76 | 144 | 154 | 90 |
| 162 | Irvine, CA | 30.75 | 164 | 64 | 181 | 118 | 159 | 96 | 156 |
| 163 | Huntsville, AL | 30.59 | 142 | 150 | 110 | 111 | 99 | 121 | 151 |
| 164 | Nashua, NH | 30.52 | 157 | 176 | 155 | 19 | 180 | 126 | 93 |
| 165 | Brownsville, TX | 30.37 | 171 | 174 | 132 | 51 | 52 | 179 | 11 |
| 166 | Overland Park, KS | 30.21 | 132 | 157 | 169 | 18 | 160 | 93 | 179 |
| 167 | San Jose, CA | 30.09 | 120 | 132 | 179 | 172 | 119 | 53 | 148 |
| 168 | Chesapeake, VA | 30.06 | 154 | 121 | 98 | 60 | 157 | 141 | 169 |
| 169 | Cape Coral, FL | 29.77 | 173 | 124 | 129 | 139 | 89 | 149 | 128 |
| 170 | Virginia Beach, VA | 29.56 | 175 | 128 | 114 | 154 | 143 | 64 | 171 |
| 171 | South Burlington, VT | 29.46 | 124 | 95 | 172 | 43 | 165 | 182 | 182 |
| 172 | Honolulu, HI | 29.38 | 180 | 172 | 170 | 56 | 69 | 125 | 116 |
| 173 | Boise, ID | 29.36 | 129 | 179 | 148 | 149 | 123 | 75 | 139 |
| 174 | Laredo, TX | 29.30 | 172 | 181 | 128 | 64 | 34 | 172 | 100 |
| 175 | Bridgeport, CT | 28.46 | 169 | 151 | 150 | 57 | 179 | 176 | 40 |
| 176 | Port St. Lucie, FL | 28.25 | 174 | 97 | 140 | 162 | 148 | 164 | 131 |
| 177 | Portland, ME | 27.50 | 152 | 175 | 136 | 68 | 173 | 142 | 163 |
| 178 | Fremont, CA | 26.76 | 139 | 111 | 182 | 121 | 154 | 171 | 155 |
| 179 | West Valley City, UT | 26.67 | 117 | 162 | 147 | 173 | 156 | 170 | 166 |
| 180 | Pearl City, HI | 26.29 | 181 | 168 | 178 | 11 | 161 | 178 | 157 |
| 181 | Madison, WI | 26.15 | 162 | 163 | 158 | 166 | 167 | 114 | 167 |
| 182 | Columbia, MD | 23.95 | 176 | 39 | 180 | 140 | 182 | 159 | 180 |
Notes: *No. 1 = Most Sinful
With the exception of “WalletHub Vice Index,” all of the columns in the table above depict the relative rank of that city, where a rank of 1 represents the worst conditions for that metric category.

- Most
- T-1. Oakland, CA
- T-1. Memphis, TN
- T-1. Detroit, MI
- T-1. Little Rock, AR
- T-1. Cleveland, OH
- Fewest
- 175. Gilbert, AZ
- 176. Port St. Lucie, FL
- 177. Virginia Beach, VA
- 178. Irvine, CA
- 179. Warwick, RI

- Most
- T-1. Oakland, CA
- T-1. Memphis, TN
- T-1. Tacoma, WA
- T-1. St. Louis, MO
- T-1. Burlington, VT
- Fewest
- 175. Nashua, NH
- 176. Gilbert, AZ
- 177. Nampa, ID
- 178. Port St. Lucie, FL
- 179. Huntsville, AL

- Most
- 1. Missoula, MT
- 2. Denver, CO
- 3. Madison, WI
- 4. Washington, DC
- 5. Billings, MT
- Least
- 178. Columbia, MD
- 179. New Haven, CT
- 180. Augusta, GA
- 181. Tulsa, OK
- 182. Montgomery, AL

- Lowest
- 1. Worcester, MA
- T-2. Manchester, NH
- T-2. Nashua, NH
- T-4. Providence, RI
- T-4. Warwick, RI
- Highest
- 178. Springfield, MO
- 179. Augusta, GA
- 180. Tallahassee, FL
- 181. Columbus, GA
- 182. Tulsa, OK

- Most
- T-1. Las Vegas, NV
- T-1. Portland, OR
- T-1. Houston, TX
- T-1. Tampa, FL
- T-1. Atlanta, GA
- Fewest
- 140. Jersey City, NJ
- 141. St. Paul, MN
- 142. Henderson, NV
- 143. Arlington, TX
- 144. Oakland, CA

- Most
- T-1. Las Vegas, NV
- T-1. Scottsdale, AZ
- T-1. Phoenix, AZ
- T-1. Pittsburgh, PA
- T-1. San Diego, CA
- Fewest
- 177. Newark, NJ
- 178. Brownsville, TX
- 179. Detroit, MI
- 180. Aurora, IL
- 181. Moreno Valley, CA

- Highest
- 1. Brownsville, TX
- 2. Laredo, TX
- 3. Newark, NJ
- 4. Fort Smith, AR
- 5. Hialeah, FL
- Lowest
- T-178. Scottsdale, AZ
- T-178. Fremont, CA
- 180. Washington, DC
- 181. South Burlington, VT
- 182. Seattle, WA
In-Depth Look at the Most Sinful Cities in 2025
Las Vegas, NV
Las Vegas tops the list of the most sinful cities this year, unsurprisingly. Sin City has the second-most casinos per capita, driving many people to lose their money in a failed quest for quick riches and creating the fourth-highest share of residents with gambling problems.
In addition, Las Vegas has the most adult entertainment options per capita, and residents search Google for terms relating to strip clubs, affairs and pornographic content more than people in most other cities.
Las Vegas also has the fifth-most fraud and identity theft complaints per capita, so greedy thieves are no stranger to the city. Many residents are vain about their appearances, too, searching Google for terms relating to plastic surgery procedures at a very high rate.
Houston, TX
Houston is the second-most sinful place this year, featuring the third-highest number of adult entertainment establishments per capita and some of the highest Google search interest for terms relating to pornography, strip clubs and affairs.
On top of that, Houston’s residents struggle with anger and hatred. The city has the 21st-highest violent crime rate in the country and the 28th-highest number of aggravated assault offenses per capita. It also had the fifth-highest number of mass shootings between January 2023 and June 2025.
Finally, many Houstonians have trouble with vices. For example, the city has the 29th-most drunk driving fatalities per capita, the eighth-highest share of residents with gambling problems, and some of the highest Google search interest for plastic surgery.
Los Angeles, CA
Los Angeles is the third-most sinful city in the U.S., in part due to violence committed by its residents. Los Angeles has the third-highest share of students bullied on school property and the 14th-most hate crimes per capita. It also had the eighth-most mass shootings between January 2023 and June 2025.
In addition, residents in Los Angeles may be a bit less giving than people in other cities. Only 24% of residents volunteer, the fifth-lowest percentage in the country. Residents also give less than 4% of their adjusted gross income to charity, the 24th-lowest percentage among the more than 180 cities in our study.
To top things off, Los Angeles residents search Google more than people in most other cities for terms stemming from lust and vanity, such as those related to pornography, extramarital affairs, and plastic surgery.
Ask the Experts
What leads many of us to partake in sinful behavior may seem like a mystery, especially when those behaviors become common in our daily lives. We asked a panel of experts for their insight on this topic as well as how to combat these bad habits. Below, you can read their bios and thoughts on the following key questions:
- To what extent is sinful behavior innate versus influenced by your surroundings?
- Is cheating within marriage becoming more or less common over time?
- Should the government play a role in trying to reduce greed and consumerism?
- What are some effective ways to combat addiction and domestic violence?
- What are some strategies that might help people steer clear of temptations (e.g., unnecessary spending, excessive drinking and eating, binge-watching, etc.) and maintain their health?
Ask the Experts

Ph.D., Emeritus Faculty (Sociology), Department of Government & Sociology - Stephen F. Austin State University & Emeritus Member, Association for the Scientific Study of Religion (ASSR)
Read More

Ph.D., Associate Professor and Chair, Department of Sociology and Co-Director, Community Research Center - University of Indianapolis
Read More

Professor of Empirical Sociology - University of Tampa
Read More

Ph.D., Assistant Professor, William F. Harrah College of Hospitality - University of Nevada, Las Vegas and Visiting Professor, Master's Program in Planning and Management of Tourism Systems Università degli Studi di Bergamo, Italy
Read More

Professor of Sociology – McNeese State University
Read More

MSEd, Ph.D. – Associate Professor, Sociology; Faculty Advisory Board Member, Ethnic Studies; Affiliate, Women's and Gender Studies – Saint Mary's College of California
Read More
Methodology
To determine the most sinful cities in America, WalletHub compared 182 cities — including the 150 most populated U.S. cities, plus at least two of the most populated cities in each state — across seven key dimensions: 1) Anger & Hatred, 2) Jealousy, 3) Excesses & Vices, 4) Greed, 5) Lust, 6) Vanity and 7) Laziness.
We examined those dimensions using 37 relevant metrics listed below with their corresponding weights. Each metric was graded on a 100-point scale, with a score of 100 representing the highest level of sinfulness. Please note that data for metrics marked with an asterisk (*) were available at the state level only. For metrics marked with two asterisks (**), the square root of the population was used to calculate the population size to avoid overcompensating for minor differences across cities.
Finally, we calculated each city’s weighted average across all metrics to determine its overall score, or WalletHub Vice Index, and used the resulting scores to rank-order the cities.
Anger & Hatred – Total Points: 14.3
- Violent Crimes per 1,000 Residents: Full Weight (~1.59 Points)
- Sex Offenders per Capita: Full Weight (~1.59 Points)
- Aggravated Assault Offenses Known to Law Enforcement per 1,000 Residents: Full Weight (~1.59 Points)
- Bullying Rate*: Full Weight (~1.59 Points)
- Hate-Crime Incidents per Capita: Full Weight (~1.59 Points)
- Hate Groups per Capita: Full Weight (~1.59 Points)
- Deaths due to Firearms per Capita: Full Weight (~1.59 Points)
- Number of Mass Shootings: Full Weight (~1.59 Points)
- Presence of Terrorist Attacks: Full Weight (~1.59 Points)
Note: This is a binary metric:
1 – There was a terrorist attack or related incident in the city.
0 – There wasn’t a terrorist attack or related incident in the city.
Jealousy – Total Points: 14.3
- Thefts per 1,000 Residents: Full Weight (~4.77 Points)
- Identity-Theft Complaints per Capita: Full Weight (~4.77 Points)
- Fraud & Other Complaints per Capita: Full Weight (~4.77 Points)
Excesses & Vices – Total Points: 14.3
- Share of Obese Adults: Full Weight (~1.43 Points)
- Fast-Food Establishments per Capita**: Full Weight (~1.43 Points)
- Excessive Drinking: Full Weight (~1.43 Points)
Note: This metric measures the age-adjusted prevalence of binge and heavy drinking among the adult population. - DUI-Related Fatalities per Capita: Full Weight (~1.43 Points)
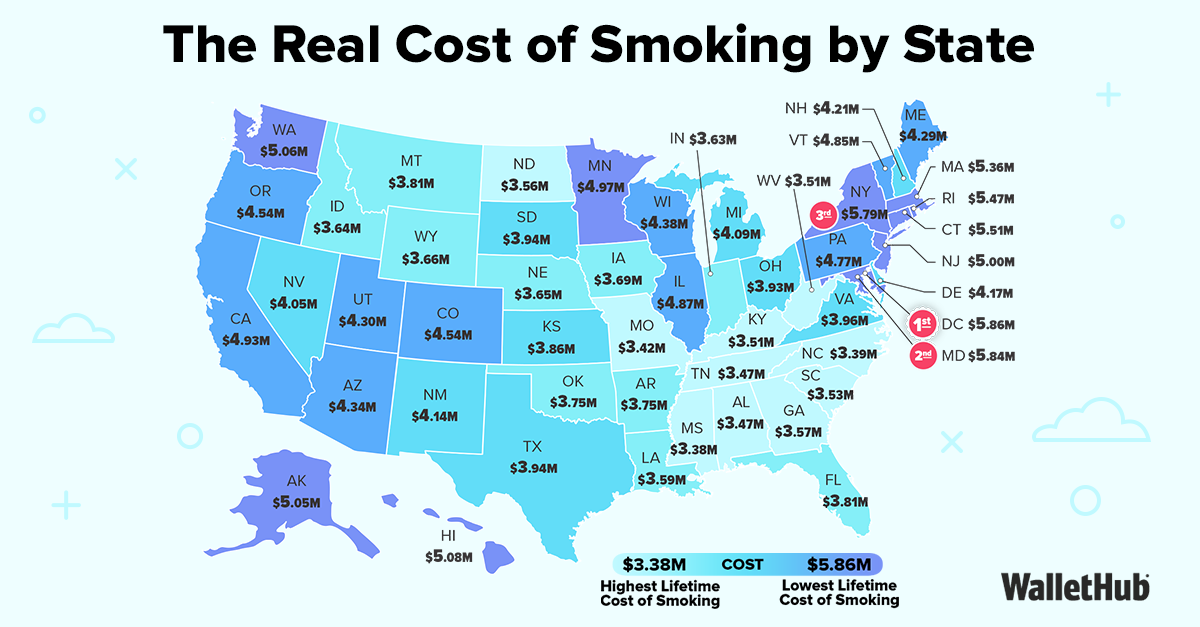
- Share of Adult Smokers: Full Weight (~1.43 Points)
- Share of Adult Coffee Drinkers: Full Weight (~1.43 Points)
Note: This metric measures the share of adults who drank ready-to-drink coffee in the past six months. - Share of Population Using Marijuana: Full Weight (~1.43 Points)
Note: This metric measures the share of residents aged 12 and older who used marijuana in the past month. - Retail Opioid Prescriptions Dispensed per 100 Persons: Full Weight (~1.43 Points)
- Drug Overdose Deaths: Full Weight (~1.43 Points)
Note: This metric measures the number of deaths due to drug poisoning per 100,000 residents. - Debt-to-Income Ratio: Full Weight (~1.43 Points)
Greed – Total Points: 14.3
- Casinos per Capita**: Full Weight (~4.77 Points)
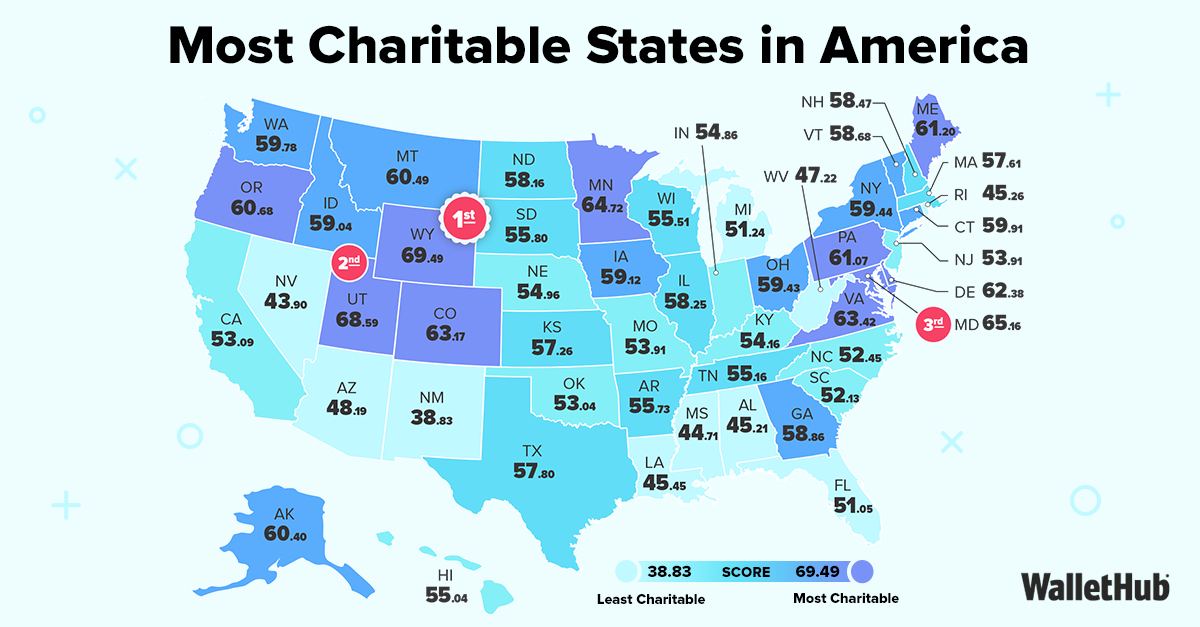
- Charitable Donations as Share of Income: Full Weight (~4.77 Points)
- Share of Adults with Gambling Disorders*: Full Weight (~4.77 Points)
Lust – Total Points: 14.3
- Adult Entertainment Establishments per Capita**: Full Weight (~3.58 Points)
- Google Search Interest Index for “XXX Entertainment”: Full Weight (~3.58 Points)
Note: This metric measures search interest for online adult entertainment. - Google Search Traffic for the Term “Tinder”: Full Weight (~3.58 Points)
Note: This metric was used as a proxy for the cities that search Tinder the most. - Teen Birth Rate: Full Weight (~3.58 Points)
Note: This metric measures the number of births per 1,000 female residents aged 15 to 19.
Vanity – Total Points: 14.3
- Tanning Salons per Capita**: Full Weight (~7.15 Points)
- Google Search Interest Index for “Top 5 Plastic Surgeries”: Full Weight (~7.15 Points)
Note: This metric measures search interest for the five most common plastic surgery procedures (rhinoplasty, blepharoplasty, facelift, liposuction, and silicone implants) as a share of the national average.
Laziness – Total Points: 14.3
- Share of Adults Not Exercising: Full Weight (~2.38 Points)
- Average Weekly Hours Worked: Full Weight (~2.38 Points)
- Volunteer Rate: Full Weight (~2.38 Points)
- Average Daily Time Spent Watching TV*: Full Weight (~2.38 Points)
- High School Dropout Rate: Full Weight (~2.38 Points)
Note: This metric was adjusted by the poverty rate. - Disconnected Youth (16-24) Rate: Full Weight (~2.38 Points)
Note: Disconnected youth are teenagers and young adults between the ages of 16 and 24 who are neither in school nor working.
Sources: Data used to create this ranking were collected as of October 20, 2025 from the U.S. Census Bureau, Bureau of Labor Statistics, Federal Bureau of Investigation, Internal Revenue Service, Advameg, Centers for Disease Control and Prevention, Federal Trade Commission, Substance Abuse and Mental Health Services Administration, County Health Rankings, TransUnion, Yelp, National Council on Problem Gambling, Corporation for National and Community Service, Esri's Updated Demographics (2024 estimates), The Southern Poverty Law Center, National Highway Traffic Safety Administration, Wm. Robert Johnston, Gun Violence Archive, Google Ads and Tinder.


WalletHub's personal finance experts are frequently cited by leading media outlets. Contact our media team to arrange an interview.