
Location can influence how bright or gloomy our daily lives feel. For decades, researchers have explored the science of happiness and identified several core factors, including mental well-being, physical health, strong social ties, job satisfaction, and financial stability. Still, income has its limits — studies show that earning more than $75,000 a year does not lead to greater happiness. This helps explain why, despite being one of the wealthiest nations in the world, the United States ranks only 24th in the World Happiness Report.
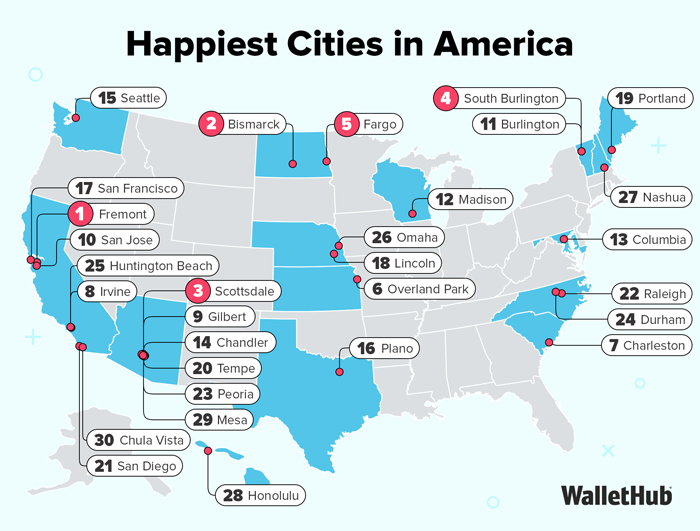
Happiness levels also vary widely across the country. As this study suggests, relocating to the right city may increase overall life satisfaction. To identify where Americans are happiest, WalletHub analyzed more than 180 of the largest U.S. cities using insights from positive-psychology research. Each city was evaluated across 29 key indicators of happiness, including depression rates, income growth, and average daily leisure time.
To see which states combine all the necessary components of happiness, check out WalletHub’s report on the Happiest States in America.

Chip Lupo, WalletHub Analyst
Main Findings
Happiest Cities in the U.S.
| Overall Rank | City | Total Score | Emotional & Physical Well-Being Rank | Income & Employment Rank | Community & Environment Rank |
|---|---|---|---|---|---|
| 1 | Fremont, CA | 74.09 | 1 | 89 | 4 |
| 2 | Bismarck, ND | 73.11 | 5 | 23 | 1 |
| 3 | Scottsdale, AZ | 71.36 | 11 | 14 | 2 |
| 4 | South Burlington, VT | 70.15 | 4 | 9 | 48 |
| 5 | Fargo, ND | 69.36 | 12 | 33 | 5 |
| 6 | Overland Park, KS | 68.45 | 2 | 55 | 68 |
| 7 | Charleston, SC | 68.44 | 17 | 10 | 3 |
| 8 | Irvine, CA | 67.99 | 8 | 39 | 32 |
| 9 | Gilbert, AZ | 67.96 | 14 | 27 | 6 |
| 10 | San Jose, CA | 67.79 | 7 | 45 | 42 |
| 11 | Burlington, VT | 67.54 | 21 | 2 | 13 |
| 12 | Madison, WI | 66.35 | 13 | 30 | 19 |
| 13 | Columbia, MD | 66.28 | 3 | 162 | 101 |
| 14 | Chandler, AZ | 65.69 | 19 | 52 | 10 |
| 15 | Seattle, WA | 65.62 | 6 | 7 | 152 |
| 16 | Plano, TX | 65.34 | 15 | 72 | 22 |
| 17 | San Francisco, CA | 64.99 | 10 | 75 | 69 |
| 18 | Lincoln, NE | 64.90 | 26 | 54 | 8 |
| 19 | Portland, ME | 64.59 | 42 | 3 | 12 |
| 20 | Tempe, AZ | 64.30 | 31 | 15 | 26 |
| 21 | San Diego, CA | 64.25 | 24 | 24 | 36 |
| 22 | Raleigh, NC | 63.47 | 22 | 92 | 29 |
| 23 | Peoria, AZ | 63.38 | 37 | 81 | 7 |
| 24 | Durham, NC | 62.84 | 34 | 49 | 34 |
| 25 | Huntington Beach, CA | 62.80 | 20 | 70 | 80 |
| 26 | Omaha, NE | 62.58 | 35 | 91 | 15 |
| 27 | Nashua, NH | 62.49 | 38 | 80 | 11 |
| 28 | Honolulu, HI | 62.10 | 43 | 48 | 30 |
| 29 | Mesa, AZ | 61.40 | 52 | 36 | 25 |
| 30 | Chula Vista, CA | 61.31 | 36 | 87 | 45 |
| 31 | Jersey City, NJ | 61.14 | 16 | 154 | 75 |
| 32 | Boise, ID | 60.96 | 44 | 5 | 92 |
| 33 | Washington, DC | 60.85 | 9 | 74 | 173 |
| 34 | Minneapolis, MN | 60.79 | 25 | 32 | 117 |
| 35 | Aurora, IL | 60.74 | 27 | 141 | 52 |
| 36 | Sioux Falls, SD | 60.71 | 23 | 28 | 154 |
| 37 | Missoula, MT | 60.55 | 61 | 21 | 43 |
| 38 | Yonkers, NY | 60.38 | 18 | 146 | 99 |
| 39 | Austin, TX | 60.36 | 40 | 20 | 97 |
| 40 | Santa Clarita, CA | 60.28 | 33 | 131 | 62 |
| 41 | Cape Coral, FL | 60.27 | 50 | 101 | 18 |
| 42 | Pembroke Pines, FL | 60.24 | 30 | 150 | 47 |
| 43 | Glendale, CA | 60.23 | 46 | 119 | 24 |
| 44 | Chesapeake, VA | 59.99 | 58 | 121 | 14 |
| 44 | Santa Rosa, CA | 59.99 | 54 | 50 | 50 |
| 46 | Pearl City, HI | 59.86 | 29 | 156 | 90 |
| 47 | Oceanside, CA | 59.79 | 41 | 82 | 83 |
| 48 | Garden Grove, CA | 59.73 | 63 | 47 | 36 |
| 49 | Rancho Cucamonga, CA | 59.69 | 51 | 77 | 46 |
| 50 | Charlotte, NC | 59.64 | 57 | 117 | 21 |
| 51 | Manchester, NH | 59.10 | 66 | 58 | 33 |
| 52 | Oakland, CA | 59.03 | 28 | 123 | 114 |
| 53 | Fort Lauderdale, FL | 58.39 | 47 | 98 | 91 |
| 54 | Virginia Beach, VA | 58.19 | 60 | 112 | 60 |
| 55 | Anaheim, CA | 58.07 | 68 | 69 | 61 |
| 56 | Phoenix, AZ | 58.05 | 67 | 78 | 59 |
| 57 | Cedar Rapids, IA | 57.99 | 56 | 130 | 55 |
| 58 | Nampa, ID | 57.91 | 80 | 13 | 73 |
| 59 | New York, NY | 57.63 | 48 | 152 | 71 |
| 60 | Salt Lake City, UT | 57.30 | 70 | 40 | 85 |
| 61 | Port St. Lucie, FL | 57.14 | 73 | 84 | 67 |
| 62 | Pittsburgh, PA | 56.94 | 76 | 11 | 105 |
| 63 | Boston, MA | 56.88 | 45 | 8 | 172 |
| 64 | Santa Ana, CA | 56.80 | 90 | 18 | 56 |
| 65 | Denver, CO | 56.74 | 32 | 139 | 150 |
| 66 | Warwick, RI | 56.59 | 62 | 113 | 96 |
| 67 | Orlando, FL | 56.59 | 69 | 19 | 133 |
| 68 | Tampa, FL | 56.46 | 77 | 68 | 81 |
| 69 | Huntsville, AL | 56.40 | 96 | 35 | 20 |
| 70 | Irving, TX | 56.39 | 78 | 83 | 79 |
| 71 | St. Paul, MN | 56.33 | 53 | 122 | 119 |
| 72 | Fontana, CA | 56.15 | 91 | 62 | 35 |
| 73 | Colorado Springs, CO | 56.13 | 87 | 73 | 53 |
| 74 | Oxnard, CA | 56.07 | 88 | 100 | 31 |
| 75 | Glendale, AZ | 55.86 | 82 | 97 | 74 |
| 76 | Atlanta, GA | 55.77 | 64 | 86 | 131 |
| 77 | Billings, MT | 55.76 | 101 | 46 | 28 |
| 78 | Miami, FL | 55.74 | 65 | 12 | 162 |
| 79 | Juneau, AK | 55.56 | 39 | 43 | 181 |
| 80 | Sacramento, CA | 55.54 | 84 | 25 | 110 |
| 81 | Portland, OR | 55.36 | 58 | 106 | 142 |
| 82 | Aurora, CO | 55.18 | 49 | 158 | 128 |
| 83 | Chicago, IL | 54.97 | 55 | 167 | 98 |
| 84 | Rapid City, SD | 54.85 | 81 | 16 | 157 |
| 85 | Ontario, CA | 54.77 | 99 | 59 | 49 |
| 86 | Columbia, SC | 54.49 | 121 | 66 | 9 |
| 87 | Los Angeles, CA | 54.46 | 75 | 96 | 126 |
| 88 | Henderson, NV | 54.46 | 102 | 149 | 16 |
| 89 | Anchorage, AK | 54.32 | 71 | 79 | 145 |
| 90 | Grand Rapids, MI | 54.28 | 100 | 44 | 77 |
| 91 | St. Petersburg, FL | 54.23 | 85 | 88 | 108 |
| 92 | Garland, TX | 54.20 | 95 | 115 | 54 |
| 93 | Riverside, CA | 54.19 | 97 | 37 | 89 |
| 94 | Long Beach, CA | 54.18 | 72 | 126 | 123 |
| 95 | New Haven, CT | 54.14 | 103 | 53 | 72 |
| 96 | Bridgeport, CT | 54.01 | 79 | 178 | 38 |
| 97 | Reno, NV | 53.91 | 112 | 42 | 57 |
| 98 | Providence, RI | 53.52 | 118 | 6 | 100 |
| 99 | Winston-Salem, NC | 53.47 | 116 | 99 | 40 |
| 100 | Tallahassee, FL | 53.39 | 98 | 38 | 107 |
| 101 | Hialeah, FL | 53.29 | 83 | 102 | 135 |
| 102 | West Valley City, UT | 53.18 | 120 | 63 | 39 |
| 103 | Des Moines, IA | 52.56 | 92 | 124 | 104 |
| 104 | Salem, OR | 52.41 | 110 | 65 | 93 |
| 105 | Tacoma, WA | 52.40 | 86 | 118 | 148 |
| 106 | Grand Prairie, TX | 52.34 | 111 | 147 | 27 |
| 107 | Moreno Valley, CA | 52.33 | 123 | 95 | 44 |
| 108 | Greensboro, NC | 52.03 | 106 | 107 | 94 |
| 109 | Lexington-Fayette, KY | 51.83 | 93 | 143 | 103 |
| 110 | Cheyenne, WY | 51.71 | 89 | 60 | 167 |
| 111 | Dallas, TX | 51.63 | 94 | 116 | 129 |
| 112 | Modesto, CA | 51.42 | 127 | 94 | 65 |
| 113 | Fort Worth, TX | 50.93 | 126 | 120 | 78 |
| 114 | Vancouver, WA | 50.34 | 74 | 129 | 178 |
| 115 | Stockton, CA | 50.18 | 115 | 85 | 138 |
| 116 | Worcester, MA | 50.12 | 109 | 57 | 164 |
| 117 | Columbus, OH | 50.02 | 119 | 151 | 84 |
| 118 | Spokane, WA | 49.98 | 108 | 34 | 169 |
| 119 | Arlington, TX | 49.91 | 128 | 133 | 87 |
| 120 | Oklahoma City, OK | 49.57 | 141 | 136 | 51 |
| 121 | Las Cruces, NM | 49.37 | 113 | 41 | 171 |
| 122 | Tucson, AZ | 49.22 | 138 | 90 | 106 |
| 123 | Norfolk, VA | 48.98 | 122 | 137 | 125 |
| 124 | Albuquerque, NM | 48.97 | 105 | 67 | 174 |
| 125 | Jacksonville, FL | 48.92 | 139 | 132 | 86 |
| 126 | Richmond, VA | 48.86 | 104 | 161 | 147 |
| 127 | Kansas City, MO | 48.79 | 124 | 135 | 120 |
| 128 | Houston, TX | 48.78 | 107 | 148 | 153 |
| 129 | Casper, WY | 48.55 | 114 | 109 | 163 |
| 130 | North Las Vegas, NV | 48.43 | 156 | 159 | 17 |
| 131 | Springfield, MO | 48.14 | 152 | 64 | 82 |
| 132 | Fort Wayne, IN | 48.14 | 130 | 153 | 118 |
| 133 | Nashville, TN | 48.14 | 129 | 108 | 151 |
| 134 | Newport News, VA | 48.13 | 134 | 155 | 95 |
| 135 | Lubbock, TX | 48.12 | 144 | 31 | 139 |
| 136 | Fresno, CA | 47.96 | 143 | 51 | 140 |
| 137 | El Paso, TX | 47.95 | 145 | 105 | 102 |
| 138 | Las Vegas, NV | 47.87 | 146 | 160 | 66 |
| 139 | San Bernardino, CA | 47.72 | 148 | 76 | 111 |
| 140 | Laredo, TX | 47.71 | 160 | 4 | 121 |
| 141 | Louisville, KY | 47.67 | 117 | 173 | 127 |
| 142 | Rochester, NY | 47.54 | 137 | 114 | 144 |
| 143 | Amarillo, TX | 47.51 | 158 | 71 | 76 |
| 144 | Philadelphia, PA | 47.35 | 136 | 134 | 136 |
| 145 | Lewiston, ME | 47.28 | 175 | 1 | 63 |
| 146 | Cincinnati, OH | 47.07 | 142 | 144 | 109 |
| 147 | Newark, NJ | 47.04 | 131 | 175 | 112 |
| 148 | Indianapolis, IN | 46.91 | 135 | 169 | 115 |
| 149 | Buffalo, NY | 46.89 | 132 | 128 | 160 |
| 150 | Brownsville, TX | 46.79 | 167 | 29 | 70 |
| 151 | Wichita, KS | 46.70 | 133 | 127 | 161 |
| 152 | Bakersfield, CA | 46.44 | 153 | 111 | 113 |
| 153 | Milwaukee, WI | 45.61 | 140 | 164 | 137 |
| 154 | San Antonio, TX | 45.58 | 149 | 93 | 158 |
| 155 | Corpus Christi, TX | 45.53 | 157 | 61 | 146 |
| 156 | Chattanooga, TN | 45.50 | 147 | 110 | 156 |
| 157 | Fayetteville, NC | 45.42 | 166 | 142 | 41 |
| 158 | Tulsa, OK | 45.33 | 168 | 103 | 88 |
| 159 | New Orleans, LA | 45.19 | 154 | 104 | 149 |
| 160 | Mobile, AL | 44.85 | 159 | 166 | 58 |
| 161 | Little Rock, AR | 44.48 | 155 | 138 | 134 |
| 162 | Wilmington, DE | 44.34 | 125 | 145 | 180 |
| 163 | Knoxville, TN | 44.04 | 164 | 26 | 166 |
| 164 | St. Louis, MO | 43.53 | 150 | 170 | 143 |
| 165 | Jackson, MS | 42.60 | 165 | 177 | 64 |
| 166 | Charleston, WV | 42.18 | 176 | 17 | 159 |
| 167 | Gulfport, MS | 41.65 | 178 | 157 | 23 |
| 168 | Montgomery, AL | 41.35 | 163 | 172 | 129 |
| 169 | Columbus, GA | 40.61 | 170 | 174 | 116 |
| 170 | Baton Rouge, LA | 40.47 | 169 | 140 | 165 |
| 171 | Birmingham, AL | 40.37 | 161 | 165 | 170 |
| 172 | Baltimore, MD | 40.28 | 151 | 179 | 176 |
| 173 | Akron, OH | 40.11 | 171 | 168 | 122 |
| 174 | Dover, DE | 39.08 | 162 | 125 | 182 |
| 175 | Fort Smith, AR | 38.66 | 180 | 56 | 132 |
| 176 | Augusta, GA | 38.24 | 172 | 163 | 168 |
| 177 | Toledo, OH | 37.21 | 177 | 176 | 155 |
| 178 | Huntington, WV | 37.20 | 182 | 22 | 124 |
| 179 | Cleveland, OH | 36.50 | 173 | 171 | 177 |
| 180 | Shreveport, LA | 34.93 | 179 | 180 | 141 |
| 181 | Memphis, TN | 34.39 | 174 | 181 | 179 |
| 182 | Detroit, MI | 29.55 | 181 | 182 | 175 |
Note: With the exception of “Total Score,” all of the columns in the table above depict the relative rank of that city, where a rank of 1 represents the best conditions for that metric category.

- Lowest
- 1. Jersey City, NJ
- 2. Hialeah, FL
- 3. Miami, FL
- 4. Pearl City, HI
- 5. Pembroke Pines, FL
- Highest
- 178. Portland, OR
- 179. Charleston, WV
- 180. Lewiston, ME
- 181. Knoxville, TN
- 182. Huntington, WV

- Highest
- 1. South Burlington, VT
- 2. Burlington, VT
- 3. Missoula, MT
- 4. Portland, OR
- 5. Denver, CO
- Lowest
- 178. Cleveland, OH
- 179. Newark, NJ
- 180. Pearl City, HI
- 181. Honolulu, HI
- 182. Detroit, MI

- Highest
- 1. South Burlington, VT
- 2. Seattle, WA
- 3. Scottsdale, AZ
- 4. Gilbert, AZ
- 5. Washington, DC
- Lowest
- 178. Brownsville, TX
- 179. Detroit, MI
- 180. Gulfport, MS
- 181. Newark, NJ
- 182. Laredo, TX

- Lowest
- 1. Newark, NJ
- 2. Jersey City, NJ
- 3. Boston, MA
- 4. Washington, DC
- 5. New York, NY
- Highest
- T-176. Missoula, MT
- T-176. Colorado Springs, CO
- T-176. Rapid City, SD
- T-176. Juneau, AK
- T-176. Casper, WY

- Fewest
- 1. Burlington, VT
- 2. Huntington, WV
- 3. Tallahassee, FL
- 4. New Haven, CT
- T-5. Bridgeport, CT
- T-5. Buffalo, NY
- Most
- 178. Washington, DC
- 179. Anchorage, AK
- 180. Dallas, TX
- T-181. Scottsdale, AZ
- T-181. Cheyenne, WY

- Highest
- 1. Miami, FL
- 2. Providence, RI
- 3. Hialeah, FL
- 4. Nampa, ID
- 5. Oakland, CA
- Lowest
- 178. Gulfport, MS
- 179. Cedar Rapids, IA
- 180. Anchorage, AK
- 181. Casper, WY
- 182. Juneau, AK

- Lowest
- 1. Fremont, CA
- 2. Irvine, CA
- 3. Pearl City, HI
- 4. Gilbert, AZ
- 5. San Jose, CA
- Highest
- 178. Wilmington, DE
- 179. Rochester, NY
- 180. Birmingham, AL
- 181. Detroit, MI
- 182. Cleveland, OH
In-Depth Look at the Happiest Cities
Fremont, CA
Fremont, CA, is the happiest city in America, and one contributing factor is that the city has the highest share of households with an income above $75,000, at nearly 80%. Studies have shown that increasing your income up to $75,000 also increases your happiness, but making more than that does not. Therefore, cities where a lot of people make at least $75,000 per year are more likely to have maximized their happiness. People in Fremont also have the highest rate of life satisfaction, the seventh-lowest depression rate, and the fifth-highest average life expectancy in the country.
Another contributing factor to Fremont’s happiness is the fact that it has the lowest separation and divorce rate in the country, at only 9.3%. It also has the lowest share of adults who report having 14 or more mentally unhealthy days per month, so people in the city seem to be taking care of themselves psychologically.
Finally, Fremont also ranks fifth among the most caring cities in America, and when people care for each other, they boost each other’s happiness.
Bismarck, ND
The second-happiest city is Bismarck, ND, in part because it has the ninth-highest percentage of adults who report having good or better health, allowing residents to maintain a higher quality of life. It also has the 13th-lowest share of people who sleep less than seven hours per night, meaning families are more well-rested and better equipped to handle daily life with less stress.
In addition, Bismarck has the seventh-highest score on Sharecare’s Community Well-Being Index, which measures how much residents like where they live, feel safe, and take pride in their community. This high ranking reflects a strong sense of satisfaction and connection among residents, contributing to overall quality of life.
To top things off, Bismarck has the largest average amount of leisure time per day, measured in minutes, allowing residents more opportunities to unwind, spend time with loved ones, and focus on personal interests.
Scottsdale, AZ
Scottsdale, AZ, is the third-happiest city, in large part because its residents are healthy. More than 88% of adults in Scottsdale report having good or better health, the third-highest percentage in the country. In addition, nearly 87% participate in physical activities.
Scottsdale residents don’t just have good physical health, though – their mental health is also well taken care of. For example, the city has the third-lowest percentage of adults who report having 14 or more mentally unhealthy days per month.
Finally, people in Scottsdale have good incomes, which can also boost their happiness. About 65% of households in the city make over $75,000 per year, the income level that’s been demonstrated to maximize happiness, and just 7% of residents reported incomes below the poverty level in the past 12 months.
Ask the Experts
Many factors can affect a person’s happiness. For additional insight, we asked a panel of experts for their thoughts on the following key questions:
- What tips do you have for someone who is unhappy with their career?
- Does an individual’s happiness increase or decrease with age?
- How much and in what ways does where you live influence your happiness?
- Can money buy happiness?
- Does the overall economic climate of a city affect individual happiness?
Ask the Experts

Ph.D. – Director, Strategic Research, School for Professional Studies - Saint Louis University
Read More

Ph.D. – Professor of Marketing - Saint Joseph’s University
Read More

Ph.D., ABPP – Professor of Psychology - Roosevelt University
Read More

Ph.D. – Associate Professor, College of Business and Management - Lynn University
Read More

Ph.D. – Professor, The Collins College of Hospitality Management - Cal Poly Pomona
Read More

Director, Hospitality and Sport Management - Northampton Community College
Read More
Methodology
In order to determine the happiest cities in America, WalletHub compared 182 of the largest cities — including the 150 most populated U.S. cities, plus at least two of the most populated cities in each state — across three key dimensions: 1) Emotional & Physical Well-Being, 2) Income & Employment and 3) Community & Environment.
We evaluated these categories using 29 relevant metrics, which are listed below with their corresponding weights. Each metric was graded on a 100-point scale, with a score of 100 representing maximum happiness. Data for metrics marked with an asterisk (*) were available only at the state level.
We then determined each city’s weighted average across all metrics to calculate its overall score and used the resulting scores to rank-order our sample.
Our analysis draws upon the findings of the following research, each of which has indicated a correlation between our data and happiness:
- Happy People Live Longer: Subjective Well-Being Contributes to Health and Longevity (Chan and Diener, 2010)
- Happiness from Ordinary and Extraordinary Experiences (Bhattacharjee and Mogilner, 2014)
- Sports Participation and Happiness: Evidence from U.S. Micro Data (Huang and Humphreys, 2010)
- Unhappy Cities (Glaeser, et al., 2014)
Emotional & Physical Well-Being - Total Points: 50
- Life-Satisfaction Index: Full Weight (~3.17 Points)
- Depression Rate: Double Weight (~6.35 Points)
- Suicide Rate: Full Weight (~3.17 Points)
- Adequate-Sleep Rate: Double Weight (~6.35 Points)
- Physical-Health Index: Double Weight (~6.35 Points)
Note: This metric measures the percentage of adults reporting good or better health. - Sports-Participation Rate: Double Weight (~6.35 Points)
- Share of People Aged 12 or Older Who Used Marijuana in the Past Month: Half Weight (~1.59 Points)
- Retail Opioid Prescriptions Dispensed per 100 Persons: Quarter Weight (~0.79 Points)
- Share of Adults with Mental Health Not Good: Double Weight (~6.35 Points)
Note: This metric measures the percentage of adults with 14 or more mentally unhealthy days reported in the past month. - Life Expectancy: Full Weight (~3.17 Points)
- Food-Insecurity Rate: Double Weight (~6.35 Points)
Income & Employment - Total Points: 25
- Income-Growth Rate: Double Weight (~3.13 Points)
- Share of Households Earning Annual Incomes Above $75,000: Full Weight (~1.56 Points)
- Poverty Rate: Full Weight (~1.56 Points)
- Job Satisfaction: Full Weight (~1.56 Points)
- 4+ Star Job Opportunities per Total People in the Labor Force: Full Weight (~1.56 Points)
Note: This metric measures the number of job opportunities at 4+ star rated companies on Glasssdoor.com per the total people in the labor force. - Job Security: Full Weight (~1.56 Points)
Note: This metric measures the probability of unemployment. - Unemployment Rate: Double Weight (~3.13 Points)
- Underemployment Rate: Double Weight (~3.13 Points)
- Bankruptcy Rate: Double Weight (~3.13 Points)
- Weekly Work Hours: Double Weight (~3.13 Points)
- Commute Time: Full Weight (~1.56 Points)
Community & Environment - Total Points: 25
- WalletHub’s "Most Caring Cities" Ranking: Full Weight (~3.57 Points)
- Separation & Divorce Rate: Full Weight (~3.57 Points)
- Hate-Crime Incidents per Capita: Full Weight (~3.57 Points)
- Ideal Weather: Half Weight (~1.79 Points)
Note: This metric uses data from WalletHub’s "Cities with the Best & Worst Weather" ranking. - Acres of Parkland per 1,000 Residents: Half Weight (~1.79 Points)
- Average Leisure Time Spent per Day*: Double Weight (~7.14 Points)
- Well-Being “Community” Index Score: Full Weight (~3.57 Points)
Note: This metric refers to the “Community” section of the Sharecare Well-Being Index, which refers to “liking where you live, feeling safe and having pride in your community.”
Sources: Data used to create this ranking were collected as of February 10, 2026 from the U.S. Census Bureau, Bureau of Labor Statistics, Federal Bureau of Investigation, Centers for Disease Control and Prevention, Sharecare Community Well-Being Index, Substance Abuse and Mental Health Services Administration, Feeding America, Chmura Economics & Analytics, Administrative Office of the U.S. Courts, Minnesota Population Center, University of Minnesota, The Trust for Public Land, Institute for Health Metrics and Evaluation, Glassdoor.com, Indeed and WalletHub research.


WalletHub's personal finance experts are frequently cited by leading media outlets. Contact our media team to arrange an interview.