

Fatherhood is a responsibility that has evolved significantly over time. In 1972, 85% of American families depended on a single income, typically earned by the father, who spent most of the week at work while mothers stayed home to care for the children. Today, 72.1% of married mothers are part of the workforce. While that figure still trails the 94.4% of married fathers who work, the gap continues to narrow.
Modern fathers no longer fit the traditional image of solely being the married breadwinner and disciplinarian. This shift has become even more noticeable in recent years, as many dads have temporarily or permanently transitioned to working from home and, in turn, taken on greater childcare responsibilities.
However, not all working fathers face the same circumstances. Those living in states with stronger economic opportunities and a higher quality of life tend to fare better than others.
To identify the best states for men balancing the dual responsibilities of parent and provider, WalletHub compared all 50 U.S. states and the District of Columbia across 22 key indicators of support for working fathers. The analysis considered factors ranging from the average workday length for men to childcare costs and the percentage of men in good or better health.

Chip Lupo, WalletHub Analyst
Main Findings
Best States for Working Dads
| Overall Rank | State | Total Score | Economic & Social Well-Being Rank | Work-Life Balance Rank | Child Care Rank | Health Rank |
|---|---|---|---|---|---|---|
| 1 | Massachusetts | 80.30 | 5 | 1 | 2 | 1 |
| 2 | Connecticut | 75.68 | 8 | 8 | 1 | 4 |
| 3 | District of Columbia | 73.56 | 2 | 4 | 9 | 5 |
| 4 | New Jersey | 69.22 | 7 | 5 | 11 | 6 |
| 5 | Rhode Island | 68.32 | 27 | 2 | 6 | 10 |
| 6 | Minnesota | 67.07 | 1 | 14 | 8 | 3 |
| 7 | New Hampshire | 63.34 | 3 | 27 | 12 | 8 |
| 8 | Virginia | 63.32 | 4 | 23 | 7 | 13 |
| 9 | Vermont | 61.26 | 30 | 12 | 4 | 7 |
| 10 | Washington | 61.13 | 18 | 3 | 36 | 17 |
| 11 | Maryland | 60.98 | 13 | 15 | 15 | 12 |
| 12 | Wisconsin | 60.71 | 9 | 11 | 20 | 21 |
| 13 | Illinois | 60.11 | 10 | 19 | 13 | 19 |
| 14 | New York | 59.64 | 42 | 10 | 10 | 11 |
| 15 | Maine | 57.81 | 34 | 13 | 3 | 30 |
| 16 | Pennsylvania | 57.22 | 11 | 28 | 18 | 24 |
| 17 | Delaware | 56.85 | 22 | 24 | 16 | 20 |
| 18 | Indiana | 56.52 | 24 | 29 | 5 | 36 |
| 19 | Nebraska | 55.83 | 15 | 31 | 21 | 15 |
| 20 | North Dakota | 55.61 | 14 | 49 | 14 | 9 |
| 21 | Utah | 54.15 | 25 | 16 | 25 | 14 |
| 22 | Ohio | 54.01 | 6 | 26 | 28 | 29 |
| 23 | Kansas | 53.65 | 21 | 17 | 24 | 31 |
| 24 | Colorado | 53.60 | 19 | 21 | 27 | 22 |
| 25 | Iowa | 53.39 | 12 | 25 | 31 | 16 |
| 26 | South Dakota | 52.91 | 20 | 37 | 22 | 23 |
| 27 | Wyoming | 52.43 | 23 | 35 | 19 | 34 |
| 28 | Hawaii | 52.37 | 50 | 9 | 23 | 2 |
| 29 | Tennessee | 50.14 | 28 | 39 | 17 | 48 |
| 30 | Oregon | 48.77 | 45 | 7 | 45 | 32 |
| 31 | California | 48.14 | 49 | 6 | 41 | 18 |
| 32 | Missouri | 48.07 | 16 | 36 | 37 | 39 |
| 33 | Michigan | 48.07 | 17 | 42 | 40 | 26 |
| 34 | Montana | 46.53 | 38 | 40 | 26 | 27 |
| 35 | North Carolina | 46.24 | 29 | 30 | 42 | 28 |
| 36 | Kentucky | 45.70 | 36 | 22 | 29 | 44 |
| 37 | Georgia | 44.62 | 26 | 47 | 33 | 40 |
| 38 | Florida | 43.69 | 44 | 32 | 32 | 33 |
| 39 | Texas | 43.29 | 32 | 43 | 35 | 42 |
| 40 | Alaska | 43.03 | 33 | 44 | 38 | 38 |
| 41 | Idaho | 41.65 | 39 | 41 | 47 | 25 |
| 42 | South Carolina | 41.15 | 35 | 45 | 46 | 37 |
| 43 | Arkansas | 40.72 | 43 | 34 | 34 | 49 |
| 44 | Arizona | 40.12 | 41 | 20 | 51 | 35 |
| 45 | Oklahoma | 39.95 | 46 | 46 | 30 | 45 |
| 46 | West Virginia | 38.58 | 47 | 33 | 43 | 51 |
| 47 | Alabama | 38.36 | 31 | 50 | 50 | 43 |
| 48 | Mississippi | 37.86 | 40 | 51 | 39 | 46 |
| 49 | Nevada | 37.65 | 48 | 38 | 48 | 41 |
| 50 | Louisiana | 37.14 | 37 | 48 | 49 | 47 |
| 51 | New Mexico | 36.11 | 51 | 18 | 44 | 50 |
Note: With the exception of “Total Score,” all of the columns in the table above depict the relative rank of that state, where a rank of 1 represents the best conditions for that metric category.

- Lowest
- 1. Mississippi
- 2. South Dakota
- 3. Kansas
- 4. Minnesota
- 5. Georgia
- Highest
- 47. Nebraska
- 48. Washington
- 49. New York
- 50. Oregon
- 51. New Mexico

- Lowest
- 1. New Hampshire
- 2. Vermont
- 3. Massachusetts
- 4. Minnesota
- 5. North Dakota
- Highest
- 47. Mississippi
- 48. Oklahoma
- 49. Arkansas
- 50. West Virginia
- 51. New Mexico

- Highest
- 1. District of Columbia
- 2. Virginia
- 3. Minnesota
- 4. New Jersey
- 5. Illinois
- Lowest
- 47. Maine
- 48. Alaska
- 49. Nevada
- 50. New Mexico
- 51. Hawaii

- Lowest
- T-1. Nebraska
- T-1. South Dakota
- T-1. North Dakota
- T-1. Utah
- T-1. Idaho
- Highest
- 47. Nevada
- 48. Rhode Island
- 49. California
- 50. New York
- 51. West Virginia

- Lowest
- 1. Massachusetts
- 2. Hawaii
- 3. District of Columbia
- 4. Vermont
- 5. Minnesota
- Highest
- T-46. Mississippi
- T-46. Nevada
- 48. Florida
- 49. Georgia
- 50. Oklahoma
- 51. Texas

- Highest
- 1. Hawaii
- 2. Massachusetts
- 3. New Jersey
- 4. Utah
- 5. New York
- Lowest
- 47. Alabama
- 48. Tennessee
- 49. Louisiana
- 50. West Virginia
- 51. Mississippi

- Lowest
- 1. Vermont
- 2. California
- 3. Rhode Island
- T-4. New Mexico
- T-4. New York
- Highest
- 47. South Dakota
- 48. Louisiana
- 49. North Dakota
- 50. Wyoming
- 51. Alaska
Note: Median family income and poverty stats refer to families with kids under 18 years old with the father present.
In-Depth Look at the Best Places for Working Dads
Massachusetts
Massachusetts is the best state for working dads, largely because it has great economic conditions for dads. For example, the median income for families with children under 18 and a father present is $129,500 after adjusting for living costs, which is sixth-highest in the nation. Massachusetts also has the third-lowest poverty rate for kids whose father is present, at 5.1%. In addition, it has the best parental leave policies of any state, allowing fathers adequate time off work when a new child joins their family.
Getting their children a solid education and good child care is naturally a big concern for working dads. Massachusetts has the best school systems in the country, along with a relatively high number of child care workers per capita.
Finally, the Bay State is a great place for men’s health. It has the third-highest percentage of men in good or better health, plus the lowest percentage of men who don’t have health insurance.
Connecticut
Connecticut is the second-best state for working dads, with the second-best school system in the country and the highest percentage of child care centers that are nationally accredited. This ensures kids are well taken care of while their dad is at work.
In addition, the Constitution State has the third-highest percentage of working men who are economically secure, at 76%. Economic security means being able to meet all their basic monthly expenses while also growing their assets modestly.
Finally, Connecticut is a good place for men to stay healthy in body and mind, with 85.7% of men in good or better health and one of the lowest suicide rates for men in the country.
District of Columbia
The District of Columbia ranks as the third-best place for working dads to live. It has the highest median income for families with the father present, at $147,300, and it also has the second-highest percentage of nationally accredited child care centers, giving working dads greater peace of mind during the workday.
D.C. is a place where both dads and their kids are able to stay healthy. The District has the highest share of men in good or better health and the highest share of physically-active men. It also leads the country when it comes to the number of pediatricians per capita.
To top things off, D.C. has resources that help fathers spend more time with their kids. It has the second-best parental leave policies in the nation, for example, and it is one of the better places for working from home.
Ask the Experts
As the contemporary working dad faces increasing challenges in his role as parent and provider, we asked a panel of experts to weigh in on the most important issues. Click on the experts’ profiles below to read their bios and thoughts on the following key questions:
- What are the biggest issues facing working dads today?
- How likely is it that men will take advantage of family leave policies adopted in New York State and elsewhere?
- How can young fathers strike the right balance between career and family?
- What impact does working from home have on fathers’ role in caring for children and housework?
- Almost 1 in 5 stay-at-home parents are dads. What are the main reasons why dads choose to stay at home
Ask the Experts

Ph.D. – Associate Professor, College of Business and Management - Lynn University
Read More

Professor, Family and Consumer Sciences Education, College of Health and Human Sciences – Colorado State University
Read More

Creator of MCEM Programs and Associate Professor, School of Teaching, Learning, and Developmental Sciences - Missouri State University
Read More

Ph.D., MBA, Certified Family Life Educator, Assistant Professor, Department of Psychology and Family Science - Mississippi University for Women
Read More

Ph.D. – Associate Professor of Human Development & Family Studies – Pennsylvania State University Scranton
Read More

MSW, Ph.D., Human Development and Family Science, Professor of Human Development; Department Chair – California State University Monterey Bay
Read More
Methodology
To determine the best and worst states for working dads, WalletHub compared the 50 states and the District of Columbia across four key dimensions: 1) Economic & Social Well-Being, 2) Work-Life Balance, 3) Child Care and 4) Health.
We evaluated those dimensions using 22 relevant metrics, which are listed below with their corresponding weights. Each metric was graded on a 100-point scale, with a score of 100 representing the most favorable conditions for working dads.
We then determined each state and the District’s weighted average across all metrics to calculate its overall score and used the resulting scores to rank-order our sample.
Economic & Social Well-Being – Total Points: 30
- Median Family Income (Adjusted for Cost of Living): Double Weight (~12.00 Points)
Note: “Family” refers to those with kids aged 0 to 17 and in which the father is present. - Share of Working Men Living with Economic Security: Full Weight (~6.00 Points)
Note: This metric is based on the Basic Economic Security Tables (BEST) Index, which measures how much income working adults of different family types need to be economically secure. Economic security means having “enough income to meet…basic monthly expenses—such as housing, food, transportation and child care expenses—and save for emergencies and retirement.” - Unemployment Rate for Dads with Kids Aged 0 to 17: Full Weight (~6.00 Points)
- Share of Kids Aged 0 to 17 (with Dad Present) Living in Poverty: Full Weight (~6.00 Points)
Work-Life Balance – Total Points: 30
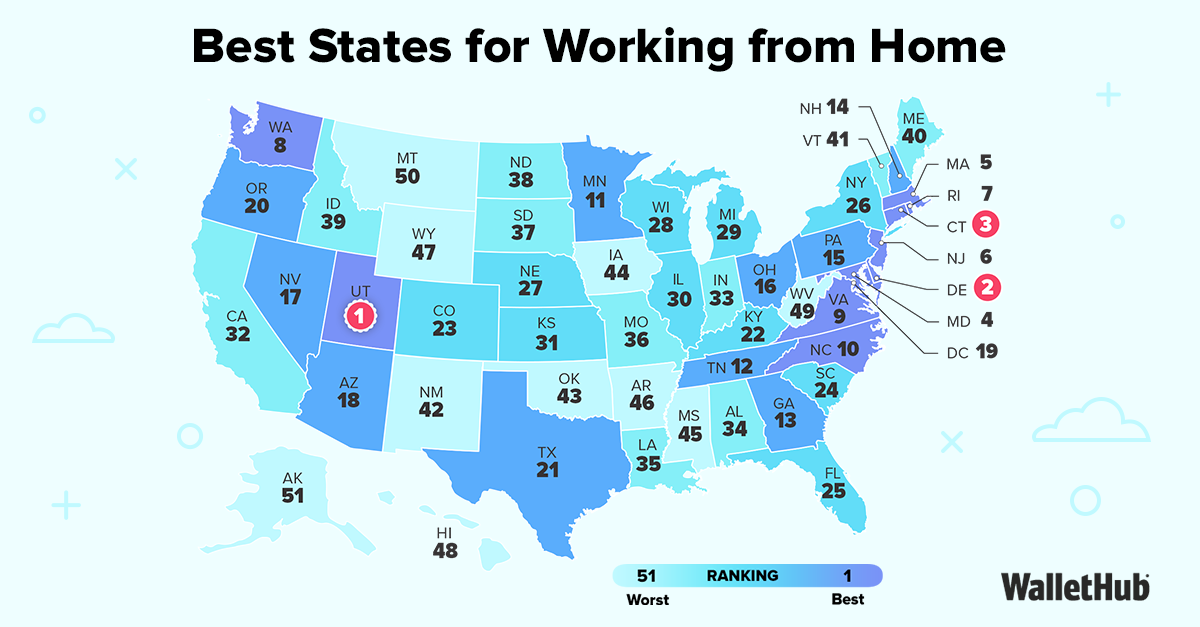
- WalletHub "Best States for Working from Home" Score: Double Weight (~6.67 Points)
Note: This metric is based on WalletHub’s “Best States for Working from Home” ranking. - Parental-Leave Policy Score: Quadruple Weight (~13.33 Points)
- Average Time Spent on Child Care for Men: Full Weight (~3.33 Points)
- Average Length of Work Day (in Hours) for Men: Full Weight (~3.33 Points)
- Average Commute Time for Men: Full Weight (~3.33 Points)
Child Care – Total Points: 30
- Day-Care Quality Score: Double Weight (~7.50 Points)
- Child-Care Costs (Adjusted for Median Family Income): Full Weight (~3.75 Points)
Note: “Family” refers to those with kids aged 0 to 17 and in which the father is present. - Pediatricians per Capita: Full Weight (~3.75 Points)
- Quality of State School System: Double Weight (~7.50 Points)
Note: This metric is based on WalletHub’s “States with the Best & Worst School Systems” ranking. - Share of Nationally Accredited Child Care Centers: Full Weight (~3.75 Points)
- Number of Childcare Workers per Children Under Age 14: Full Weight (~3.75 Points)
Health – Total Points: 10
- Male Uninsured Rate: Double Weight (~2.22 Points)
- Men’s Life Expectancy: Double Weight (~2.22 Points)
- Male Suicide Rate: Full Weight (~1.11 Points)
- Male Mental Health: Full Weight (~1.11 Points)
- Share of Men in Good or Better Health: Full Weight (~1.11 Points)
Note: This metric measures the share of men who reported having good or better health as part of a public health survey, data for which are collected and maintained by the Behavioral Risk Factor Surveillance System (BRFSS). - Share of Physically Active Men: Full Weight (~1.11 Points)
Note: This metric measures the share of men who reported engaging in adequate or any physical activity as part of a public health survey, data for which are collected and maintained by the Behavioral Risk Factor Surveillance System (BRFSS). - Unaffordability of Doctor’s Visits: Full Weight (~1.11 Points)
Note: This metric measures the percentage of men who could not afford to visit a doctor in the past 12 months due to unaffordable costs.
Sources: Data used to create this ranking were collected as of May 12, 2026 from the U.S. Census Bureau, Bureau of Labor Statistics, Council for Community and Economic Research, Centers for Disease Control and Prevention, National Partnership for Women & Families, Institute for Women's Policy Research, Child Care Aware of America, United States Mortality Database, Knee Regulatory Research Center and WalletHub research.


WalletHub's personal finance experts are frequently cited by leading media outlets. Contact our media team to arrange an interview.