
Around 72% of Americans plan to travel this summer, of whom 37% expect to take more than one trip. The only question is: Where’s the best place to go? You might have a few destinations already in mind, but your travel budget might not agree, especially with how pricey gas and airline tickets can be. It’s ideal to have fun while keeping your spending in check.
To find out which places offer the most bang for your buck, WalletHub developed a ranking of the cheapest U.S. destinations that are also easy to reach. In total, we analyzed 100 of the largest metro areas across 41 key indicators. Our data set ranges from the cost of the cheapest flight to the number of attractions to the average price of a two-person meal.
Compared with other rankings that focus on each destination’s scenic quality, this report focuses primarily on the cost and convenience of traveling to each location as well as its affordability. However, it does take into account the number of attractions and variety of activities in each destination to ensure visitors will stay busy and entertained throughout the trip. As you plan your trip, make sure to check out WalletHub’s Best Travel Credit Cards.

Chip Lupo, WalletHub Analyst
Main Findings
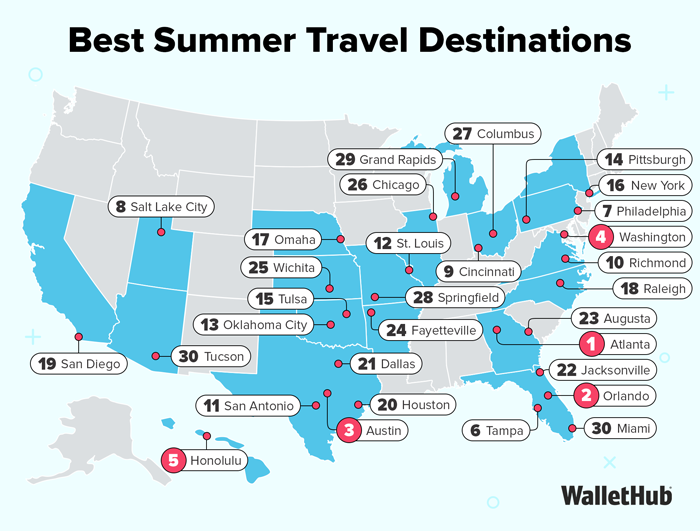
Best Places to Visit in Summer
| Overall Rank | Destination (Metro Area) |
Total Score | Travel Costs & Hassles Rank | Local Costs Rank | Attractions Rank | Weather Rank | Activities Rank | Safety Rank |
|---|---|---|---|---|---|---|---|---|
| 1 | Atlanta-Sandy Springs-Alpharetta, GA Metro Area | 69.93 | 16 | 58 | 16 | 15 | 8 | 39 |
| 2 | Orlando-Kissimmee-Sanford, FL Metro Area | 69.00 | 39 | 24 | 11 | 62 | 1 | 62 |
| 3 | Austin-Round Rock-Georgetown, TX Metro Area | 68.22 | 57 | 21 | 10 | 21 | 18 | 47 |
| 4 | Washington-Arlington-Alexandria, DC-VA-MD-WV Metro Area | 67.22 | 10 | 76 | 17 | 19 | 15 | 40 |
| 5 | Urban Honolulu, HI Metro Area | 67.12 | 1 | 99 | 19 | 1 | 2 | 18 |
| 6 | Tampa-St. Petersburg-Clearwater, FL Metro Area | 65.73 | 41 | 50 | 23 | 40 | 14 | 23 |
| 7 | Philadelphia-Camden-Wilmington, PA-NJ-DE-MD Metro Area | 65.26 | 7 | 68 | 13 | 42 | 19 | 65 |
| 8 | Salt Lake City, UT Metro Area | 64.91 | 36 | 38 | 35 | 11 | 32 | 58 |
| 9 | Cincinnati, OH-KY-IN Metro Area | 64.86 | 52 | 28 | 37 | 48 | 6 | 15 |
| 10 | Richmond, VA Metro Area | 64.70 | 18 | 53 | 48 | 32 | 23 | 25 |
| 11 | San Antonio-New Braunfels, TX Metro Area | 64.64 | 29 | 12 | 20 | 38 | 41 | 86 |
| 12 | St. Louis, MO-IL Metro Area | 64.14 | 61 | 44 | 26 | 12 | 17 | 45 |
| 13 | Oklahoma City, OK Metro Area | 63.91 | 27 | 1 | 47 | 17 | 78 | 71 |
| 14 | Pittsburgh, PA Metro Area | 63.89 | 38 | 40 | 33 | 71 | 12 | 8 |
| 15 | Tulsa, OK Metro Area | 63.70 | 17 | 2 | 63 | 18 | 67 | 79 |
| 16 | New York-Newark-Jersey City, NY-NJ-PA Metro Area | 63.60 | 43 | 88 | 6 | 66 | 5 | 46 |
| 17 | Omaha-Council Bluffs, NE-IA Metro Area | 63.46 | 30 | 8 | 56 | 44 | 48 | 36 |
| 18 | Raleigh-Cary, NC Metro Area | 63.42 | 28 | 42 | 42 | 22 | 58 | 21 |
| 19 | San Diego-Chula Vista-Carlsbad, CA Metro Area | 63.31 | 3 | 94 | 5 | 80 | 4 | 32 |
| 20 | Houston-The Woodlands-Sugar Land, TX Metro Area | 61.95 | 84 | 13 | 7 | 50 | 24 | 90 |
| 21 | Dallas-Fort Worth-Arlington, TX Metro Area | 61.94 | 68 | 49 | 21 | 41 | 26 | 43 |
| 22 | Jacksonville, FL Metro Area | 61.80 | 47 | 32 | 30 | 61 | 22 | 44 |
| 23 | Augusta-Richmond County, GA-SC Metro Area | 61.50 | 34 | 9 | 67 | 29 | 98 | 48 |
| 24 | Fayetteville-Springdale-Rogers, AR Metro Area | 61.23 | 33 | 30 | 81 | 25 | 90 | 22 |
| 25 | Wichita, KS Metro Area | 61.16 | 12 | 7 | 80 | 33 | 92 | 56 |
| 26 | Chicago-Naperville-Elgin, IL-IN-WI Metro Area | 61.03 | 80 | 87 | 1 | 55 | 9 | 28 |
| 27 | Columbus, OH Metro Area | 60.81 | 54 | 45 | 39 | 20 | 56 | 27 |
| 28 | Springfield, MO Metro Area | 60.77 | 21 | 31 | 70 | 27 | 80 | 73 |
| 29 | Grand Rapids-Kentwood, MI Metro Area | 60.66 | 5 | 43 | 59 | 76 | 50 | 26 |
| 30 | Miami-Fort Lauderdale-Pompano Beach, FL Metro Area | 60.43 | 50 | 85 | 8 | 67 | 7 | 67 |
| 30 | Tucson, AZ Metro Area | 60.43 | 44 | 41 | 27 | 57 | 33 | 75 |
| 32 | Nashville-Davidson--Murfreesboro--Franklin, TN Metro Area | 60.42 | 65 | 54 | 22 | 6 | 46 | 83 |
| 33 | El Paso, TX Metro Area | 60.40 | 56 | 26 | 76 | 10 | 75 | 16 |
| 34 | Los Angeles-Long Beach-Anaheim, CA Metro Area | 60.26 | 40 | 96 | 2 | 49 | 11 | 78 |
| 35 | Pensacola-Ferry Pass-Brent, FL Metro Area | 60.02 | 20 | 39 | 61 | N/A | 20 | 66 |
| 36 | Knoxville, TN Metro Area | 59.97 | 75 | 14 | 64 | 36 | 47 | 19 |
| 37 | Little Rock-North Little Rock-Conway, AR Metro Area | 59.96 | 22 | 3 | 72 | 9 | 91 | 98 |
| 38 | Charlotte-Concord-Gastonia, NC-SC Metro Area | 59.92 | 71 | 35 | 25 | 23 | 44 | 72 |
| 39 | Columbia, SC Metro Area | 59.62 | 48 | 18 | 65 | 28 | 65 | 74 |
| 40 | Milwaukee-Waukesha, WI Metro Area | 59.47 | 23 | 17 | 34 | 79 | 35 | 81 |
| 41 | Louisville/Jefferson County, KY-IN Metro Area | 59.46 | 78 | 23 | 32 | 16 | 39 | 69 |
| 42 | Detroit-Warren-Dearborn, MI Metro Area | 59.45 | 14 | 29 | 45 | 56 | 76 | 64 |
| 43 | Buffalo-Cheektowaga, NY Metro Area | 58.70 | 6 | 55 | 44 | 82 | 45 | 38 |
| 44 | New Orleans-Metairie, LA Metro Area | 58.48 | 49 | 60 | 18 | 39 | 28 | 97 |
| 45 | Lafayette, LA Metro Area | 58.34 | 26 | 20 | 84 | 47 | 88 | 70 |
| 46 | Dayton-Kettering, OH Metro Area | 57.98 | 11 | 37 | 90 | 65 | 69 | 57 |
| 47 | Albuquerque, NM Metro Area | 57.96 | 64 | 19 | 40 | 5 | 40 | 99 |
| 48 | Denver-Aurora-Lakewood, CO Metro Area | 57.81 | 51 | 64 | 14 | 70 | 13 | 96 |
| 49 | Chattanooga, TN-GA Metro Area | 57.64 | 87 | 22 | 52 | 14 | 55 | 50 |
| 50 | Las Vegas-Henderson-Paradise, NV Metro Area | 57.27 | 96 | 47 | 4 | 77 | 3 | 77 |
| 51 | Birmingham-Hoover, AL Metro Area | 56.53 | 89 | 6 | 60 | 24 | 68 | 60 |
| 52 | Boston-Cambridge-Newton, MA-NH Metro Area | 56.52 | 60 | 90 | 15 | 73 | 29 | 11 |
| 53 | Minneapolis-St. Paul-Bloomington, MN-WI Metro Area | 56.37 | 53 | 61 | 31 | 75 | 34 | 42 |
| 54 | Toledo, OH Metro Area | 56.30 | 8 | 46 | 82 | 63 | 83 | 68 |
| 55 | Madison, WI Metro Area | 56.24 | 31 | 62 | 66 | 87 | 51 | 9 |
| 56 | Virginia Beach-Norfolk-Newport News, VA-NC Metro Area | 55.77 | 70 | 73 | 54 | 26 | 37 | 53 |
| 57 | Boise City, ID Metro Area | 55.64 | 80 | 67 | 49 | 30 | 62 | 6 |
| 58 | Indianapolis-Carmel-Anderson, IN Metro Area | 55.58 | 83 | 25 | 29 | 52 | 61 | 61 |
| 59 | Corpus Christi, TX Metro Area | 55.40 | 32 | 27 | 78 | 34 | 85 | 94 |
| 60 | Greenville-Anderson, SC Metro Area | 54.99 | 59 | 51 | 62 | N/A | 21 | 63 |
| 61 | Cleveland-Elyria, OH Metro Area | 54.98 | 91 | 15 | 41 | 51 | 53 | 35 |
| 62 | Riverside-San Bernardino-Ontario, CA Metro Area | 54.96 | 24 | 92 | 79 | 7 | 66 | 52 |
| 63 | Phoenix-Mesa-Chandler, AZ Metro Area | 54.87 | 13 | 69 | 24 | 92 | 30 | 54 |
| 64 | Hartford-East Hartford-Middletown, CT Metro Area | 54.55 | 19 | 82 | 89 | 68 | 64 | 14 |
| 65 | Charleston-North Charleston, SC Metro Area | 54.37 | 92 | 79 | 50 | 3 | 16 | 49 |
| 66 | Palm Bay-Melbourne-Titusville, FL Metro Area | 54.29 | 46 | 56 | 97 | 45 | 63 | 51 |
| 67 | Akron, OH Metro Area | 54.21 | 58 | 33 | 69 | 74 | 95 | 37 |
| 68 | Greensboro-High Point, NC Metro Area | 53.99 | 63 | 36 | 73 | 35 | 89 | 82 |
| 69 | Scranton--Wilkes-Barre, PA Metro Area | 53.99 | 15 | 77 | 87 | 81 | 97 | 3 |
| 70 | Memphis, TN-MS-AR Metro Area | 53.88 | 67 | 4 | 46 | 13 | 87 | 100 |
| 71 | Lexington-Fayette, KY Metro Area | 53.38 | 74 | 57 | 51 | 54 | 82 | 24 |
| 72 | Baltimore-Columbia-Towson, MD Metro Area | 52.88 | 79 | 59 | 28 | 43 | 52 | 87 |
| 73 | Rochester, NY Metro Area | 52.76 | 72 | 72 | 53 | 85 | 36 | 13 |
| 74 | Syracuse, NY Metro Area | 52.65 | 35 | 75 | 68 | 84 | 77 | 33 |
| 75 | Kansas City, MO-KS Metro Area | 52.09 | 73 | 66 | 38 | 37 | 57 | 93 |
| 76 | Providence-Warwick, RI-MA Metro Area | 51.21 | 62 | 81 | 83 | 72 | 54 | 7 |
| 77 | Jackson, MS Metro Area | 51.03 | 99 | 10 | 92 | 8 | 96 | 41 |
| 78 | Allentown-Bethlehem-Easton, PA-NJ Metro Area | 50.66 | 88 | 65 | 93 | 60 | 81 | 2 |
| 79 | Deltona-Daytona Beach-Ormond Beach, FL Metro Area | 50.55 | 45 | 70 | 100 | 59 | 71 | 31 |
| 80 | Portland-Vancouver-Hillsboro, OR-WA Metro Area | 50.50 | 77 | 80 | 12 | 90 | 25 | 80 |
| 81 | Cape Coral-Fort Myers, FL Metro Area | 50.46 | 94 | 34 | 96 | 64 | 49 | 10 |
| 82 | San Francisco-Oakland-Berkeley, CA Metro Area | 50.38 | 25 | 98 | 3 | 95 | 10 | 95 |
| 83 | Sacramento-Roseville-Folsom, CA Metro Area | 50.28 | 85 | 91 | 43 | 31 | 38 | 55 |
| 84 | Fresno, CA Metro Area | 49.66 | 69 | 83 | 77 | 2 | 94 | 88 |
| 85 | Harrisburg-Carlisle, PA Metro Area | 49.48 | 90 | 48 | 75 | N/A | 73 | 5 |
| 86 | Spokane-Spokane Valley, WA Metro Area | 49.08 | 2 | 86 | 58 | 89 | 72 | 84 |
| 87 | Portland-South Portland, ME Metro Area | 48.69 | 66 | 84 | 55 | 93 | 27 | 1 |
| 88 | Seattle-Tacoma-Bellevue, WA Metro Area | 48.40 | 4 | 100 | 9 | 94 | 31 | 85 |
| 89 | North Port-Sarasota-Bradenton, FL Metro Area | 48.40 | 42 | 71 | 98 | N/A | 59 | 34 |
| 90 | Albany-Schenectady-Troy, NY Metro Area | 48.29 | 86 | 63 | 71 | 86 | 79 | 17 |
| 91 | Baton Rouge, LA Metro Area | 48.11 | 97 | 11 | 85 | 46 | 42 | 89 |
| 92 | Santa Rosa-Petaluma, CA Metro Area | 47.29 | 9 | 97 | 91 | 91 | 43 | 12 |
| 93 | Bakersfield, CA Metro Area | 46.83 | 82 | 78 | 95 | 4 | 93 | 91 |
| 94 | Colorado Springs, CO Metro Area | 46.50 | 76 | 74 | 36 | 78 | 70 | 92 |
| 95 | Des Moines-West Des Moines, IA Metro Area | 45.44 | 98 | 52 | 74 | 53 | 100 | 29 |
| 96 | San Jose-Sunnyvale-Santa Clara, CA Metro Area | 45.21 | 55 | 93 | 57 | 88 | 60 | 76 |
| 97 | Bridgeport-Stamford-Norwalk, CT Metro Area | 44.42 | 93 | 89 | 86 | 69 | 84 | 4 |
| 98 | Lansing-East Lansing, MI Metro Area | 44.10 | 95 | 16 | 94 | 82 | 85 | 59 |
| 99 | McAllen-Edinburg-Mission, TX Metro Area | 43.76 | 100 | 5 | 99 | 58 | 99 | 30 |
| 100 | Oxnard-Thousand Oaks-Ventura, CA Metro Area | 41.08 | 37 | 95 | 88 | 95 | 74 | 20 |
Note: With the exception of “Total Score,” all of the columns in the table above depict the relative rank of that metro area, where a rank of 1 represents the best conditions for that metric category.

- Lowest Costs & Fewest Hassles
- 1. Honolulu, HI
- 2. Spokane, WA
- 3. San Diego, CA
- 4. Seattle, WA
- 5. Grand Rapids, MI
- Highest Costs & Most Hassles
- 96. Las Vegas, NV
- 97. Baton Rouge, LA
- 98. Des Moines, IA
- 99. Jackson, MS
- 100. McAllen, TX

- Lowest Costs
- 1. Oklahoma City, OK
- 2. Tulsa, OK
- 3. Little Rock, AR
- 4. Memphis, TN
- 5. McAllen, TX
- Highest Costs
- 96. Los Angeles, CA
- 97. Santa Rosa, CA
- 98. San Francisco, CA
- 99. Honolulu, HI
- 100. Seattle, WA

- Most
- 1. Chicago, IL
- 2. Los Angeles, CA
- 3. San Francisco, CA
- 4. Las Vegas, NV
- 5. San Diego, CA
- Fewest
- 96. Cape Coral, FL
- 97. Palm Bay, FL
- 98. North Port, FL
- 99. McAllen, TX
- 100. Deltona, FL

- Most
- 1. Orlando, FL
- 2. Honolulu, HI
- 3. Las Vegas, NV
- 4. San Diego, CA
- 5. New York, NY
- Fewest
- 96. Jackson, MS
- 97. Scranton, PA
- 98. Augusta, GA
- 99. McAllen, TX
- 100. Des Moines, IA

- Most Safe
- 1. Portland, ME
- 2. Allentown, PA
- 3. Scranton, PA
- 4. Bridgeport, CT
- 5. Harrisburg, PA
- Least Safe
- 96. Denver, CO
- 97. New Orleans, LA
- 98. Little Rock, AR
- 99. Albuquerque, NM
- 100. Memphis, TN
In-Depth Look at the Best Summer Travel Destinations
Atlanta, GA
The Atlanta metro area is the best summer travel destination, in part because the shortest flights from major cities don’t require any connections and can cost as little as $317.
In addition, Atlanta has a lot of diversity when it comes to attractions. The city also ranks very well when it comes to the prevalence of spas & wellness centers, shopping centers, ice cream shops and swimming pools, so there are plenty of places to have fun and cool off.
For those who enjoy drinking during their vacations, Atlanta also has one of the latest “last call” times in the country, at 4:00 a.m.
Orlando, FL
Orlando, FL is the second-best metro area for summer travel, known for attractions like its huge theme parks. The shortest flights to Orlando from other major cities have zero connections and cost as little as $373.
Surprisingly, the lowest nightly rate for a three-star hotel room in Orlando is only $49, which is very reasonable. The metro area has plenty of affordable, high-quality restaurants to choose from, too.
Orlando also ranks highly when it comes to the prevalence of water parks, boat tours, ice cream shops, coffee shops, shopping centers and spas, providing venues to both get thrills and relax.
Austin, TX
Austin, TX, metro area is the third-best summer travel destination. The shortest flights from other major cities tend to have zero connections, though you’ll have to pay out at least $397 to fly in.
One reason why Austin is a great destination is that it’s really easy to find affordable restaurants that are rated at least 4.5 stars out of 5 on Yelp.
Austin offers a mix of culture and outdoor fun, boasting a high number of attractions including the Bullock Texas State History Museum as well as shopping centers, music venues, food festivals and hiking trails. With a cost of living lower than many other major U.S. cities, it’s a destination that’s both exciting to explore and easy on the wallet.
Ask the Experts
You shouldn’t have to wipe out your savings just to enjoy a nice summer vacation. For budget-friendly advice and other useful travel insight, we asked a panel of experts to share their thoughts on the following key questions:
- What are your predictions for the 2026 summer travel season (percent of Americans traveling; most popular destinations; busiest travel times)?
- Do you think the Federal government should block airlines from overbooking flights?
- What are the costliest travel mistakes?
- In evaluating the best summer travel destinations, what are the top five indicators?
- What tips do you have for people looking to travel on a budget?
Ask the Experts

Ph.D., Professor of Marketing - Paseka School of Business, Minnesota State University Moorhead
Read More

Ph.D. – Associate Professor, College of Business and Management - Lynn University
Read More

Ph.D., Professor Emeritus, Former Dean and Barron Hilton Distinguished Chair, Conrad N. Hilton College of Hotel and Restaurant Management, University of Houston
Read More

Ed.D., C.C.E., C.E.C. - Director, McCutchen House/Marriott Lab; Senior Lecturer, School of Hospitality and Tourism Management, College of Hospitality, Retail and Sport Management - University of South Carolina
Read More

Ph.D., Professor, The Collins College of Hospitality Management - Cal Poly Pomona
Read More

Ph.D. – Professor Emeritus, Department of Management, Walker College of Business – Appalachian State University
Read More
Methodology
In order to determine the best summer vacation spots, WalletHub compared 100 of the most populated metro areas (or Metropolitan Statistical Areas, as identified by the U.S. Census Bureau) across six key categories: 1) Travel Costs & Hassles, 2) Local Costs, 3) Attractions, 4) Weather, 5) Activities and 6) Safety.
We evaluated those categories using 41 relevant metrics, which are listed below with their corresponding weights. Each metric was graded on a 100-point scale, with a score of 100 representing the most favorable conditions for summer travel. Metrics marked with an asterisk (*) were measured by the square root of the population.
For our flight analysis, we collected data on March 5 and selected July 9 as the departure date and July 19 as the return date for the following reasons: 1) July is the most popular month for summer travel, according to an AYTM vacations survey, and 2) the average American considers 10 days to be the perfect length for a vacation, according to American Express data.
Finally, we determined each metro area’s weighted average across all metrics to calculate its overall score and used the resulting scores to rank-order our sample.
Travel Costs & Hassles - Total Points: 18
- Cost of Cheapest Flight: 30% (~5.40 Points)
- Duration of Cheapest Flight: 10% (~1.80 Points)
- Number of Connections on Cheapest Flight: 5% (~0.90 Points)
- Cost of Shortest Flight: 30% (~5.40 Points)
- Duration of Shortest Flight: 10% (~1.80 Points)
- Number of Connections on Shortest Flight: 5% (~0.90 Points)
- Share of Delayed Flights: 10% (~1.80 Points)
To determine the cheapest flight, we compared the cost of a round-trip flight between each of the 100 destinations and the six largest U.S. airport hubs in the following cities:
- Atlanta
- Chicago
- Dallas
- Denver
- Los Angeles
- New York
To determine the shortest flight, we compared the departure and return flights and chose the longer of the two. For instance, if a departure flight from Washington to Los Angeles took five hours, whereas the return flight from Los Angeles to Washington lasted six, we chose the latter.
Considering the disparities in flight costs and travel times, we also chose the best deals for each metric within a $30 range or one-hour window. For example, if the cheapest round-trip flight from Washington to Los Angeles cost $700, whereas the second-cheapest flight cost $25 more but reduced the total travel time by two hours, we chose the latter. Similarly, if the shortest round-trip flight from Washington to Los Angeles took six hours each way, whereas the second-shortest took 25 minutes longer but saved the traveler $200, we again chose the latter.
Local Costs - Total Points: 18
- Cost of Living: 26.73% (~4.81 Points)
- Average Gas Prices: 26.73% (~4.81 Points)
- Lowest Nightly Rate for Three-Star Hotel Room: 26.73% (~4.81 Points)
- Average Price of Two-Person Meal: 19.80% (~3.56 Points)
Attractions - Total Points: 18
- Number of Attractions: 50% (~9.00 Points)
- Diversity of Attractions: 50% (~9.00 Points)
Note: This metric was calculated using the Herfindahl-Hirschman Index, which is a commonly accepted measure of market concentration that also works effectively as a general-purpose measure of diversity.
Weather - Total Points: 18
Note: Based on WalletHub’s “Cities with the Best & Worst Weather” ranking, penalizing the metro areas with extreme weather.
Activities - Total Points: 18
- Restaurants per Capita*: 4.08% (~0.73 Points)
- Prevalence of Affordable Restaurants with Ratings of 4.5+ Stars: 4.08% (~0.73 Points)
- Amusement Parks per Capita*: 4.08% (~0.73 Points)
- Presence on TripAdvisor’s “Top 25 Amusement & Water Parks” List: 4.08% (~0.73 Points)
Note: Binary metric:
1 – City is present on Top 25 TripAdvisor Amusement & Water Parks
0 – City is not present on Top 25 TripAdvisor Amusement & Water Parks - Wellness & Spa Centers per Capita*: 4.08% (~0.73 Points)
- Retail Shopping Centers per Capita*: 4.08% (~0.73 Points)
- Music Venues per Capita*: 4.08% (~0.73 Points)
- Coffee & Tea Shops per Capita*: 4.08% (~0.73 Points)
- Ice-Cream & Frozen-Yogurt Shops per Capita*: 4.08% (~0.73 Points)
- Tennis Courts per Capita*: 4.08% (~0.73 Points)
- Golf Courses and Country Clubs per Capita*: 4.08% (~0.73 Points)
- Baseball & Softball Diamonds per Capita*: 4.08% (~0.73 Points)
- Basketball Hoops per Capita*: 4.08% (~0.73 Points)
- Bike-Rental Facilities per Capita*: 4.08% (~0.73 Points)
- Food Festivals per Capita*: 4.08% (~0.73 Points)
- Quality of Parks: 4.08% (~0.73 Points)
Note: Based on WalletHub’s “Best & Worst Cities for Recreation” ranking. - Public Beaches per Capita*: 4.08% (~0.73 Points)
- Presence on TripAdvisor’s “Top 25 Beaches” List: 2.04% (~0.37 Points)
Note: Binary metric:
1 – City is present on Top 25 TripAdvisor Beaches
0 – City is not present on Top 25 TripAdvisor Beaches - Water Temperature: 4.08% (~0.73 Points)
Note: This metric was used as a proxy for cities located along a sea, ocean or lake. - Swimming Pools per Capita*: 4.08% (~0.73 Points)
- Water Parks per Capita*: 4.08% (~0.73 Points)
- Boat Tours & Water Sports per Capita*: 4.08% (~0.73 Points)
- Hiking Trails per Capita*: 4.08% (~0.73 Points)
- Beer Gardens per Capita*: 4.08% (~0.73 Points)
- Time of Last Call: 4.08% (~0.73 Points)
Safety - Total Points: 10
- Violent-Crime Rate: 50% (~5.00 Points)
- Property-Crime Rate: 50% (~5.00 Points)
Sources: Data used to create this ranking were collected as of April 14, 2026 from the U.S. Census Bureau, Council for Community and Economic Research, Federal Bureau of Investigation, Bureau of Transportation Statistics, Numbeo, Kayak, TripAdvisor, Yelp, The Trust for Public Land, World Sea Temperature, American Automobile Association and WalletHub research.


WalletHub's personal finance experts are frequently cited by leading media outlets. Contact our media team to arrange an interview.