


Best 2% Cash Back Credit Cards of June 2026 Comparison
| Card Name | Ongoing Rewards | Annual Fee | Min. Credit Requirement |
| Wells Fargo Active Cash | 2% cash rewards | $0 | Good credit |
| TD Double Up Credit Card | 2% cash back | $0 | Good credit |
| Citi Double Cash Card | 2 - 5% cash back | $0 | Good credit |
| Synchrony Premier | 2% cash back | $0 | Good credit |
| Capital One Spark Cash Plus (see Rates & Fees) | 2 - 5% cash back | $150 | Excellent credit |
At the end of the day, Wells Fargo Active Cash is the best 2% cash back credit card because it offers an unlimited 2% cash rewards rate on purchases. Most 2 percent cash back credit cards put a cap on the amount you can earn with a 2%+ rate. Other credit cards only give that rate on certain categories of purchases.

Methodology
To identify the best 2% cash back credit cards, WalletHub’s editors compare 1,500+ credit card offers on a regular basis. After narrowing down the field to the cards offering at least 2% cash back on some or all purchases, we compare those offers based on their initial bonuses, ongoing rewards, annual fees, approval requirements and other WalletHub Rating components. Final selections are made based on two-year cost.
WalletHub's Key Rating Components
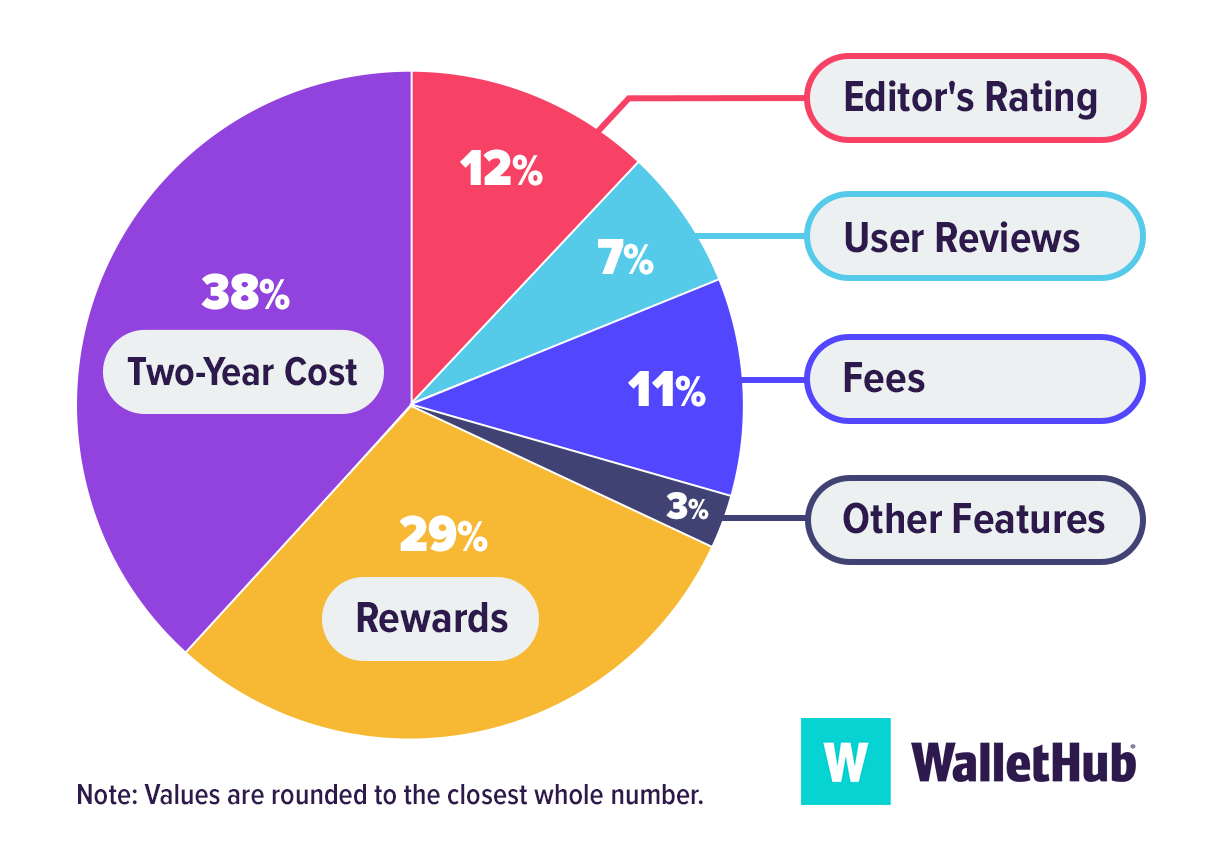
Two-Year Cost: 38% – We calculate the projected net value of holding the card for two years by weighing any annual fees against the total rewards earned, with a focus at 2% rate. For cards that charge a fee, we assess whether added benefits or bonuses meaningfully increase overall value compared to no-annual-fee alternatives.
Rewards: 29% – We evaluate how effectively each card delivers rewards to cardholders. Our analysis considers 2% earnings, as well as any other earning rates that may be available, along with the redemption options, minimum redemption thresholds, and whether the rewards program ultimately supports effortless, everyday earning.
Editor’s Rating: 12% – Our editorial team reviews each card’s overall competitiveness, how user-friendly it is, and how well it performs as a primary, go-to spending card.
Fees: 11% – We examine all potential costs, including annual fees, foreign transaction fees, and any one-time fees, to determine their impact on the card’s net rewards value and suitability for light or infrequent spenders.
User Reviews: 7% – We incorporate cardholder feedback to understand each card’s value in the eye of users.
Other Features: 3% – We consider supplementary benefits such as promotional APRs, balance transfer offers, and shopper protections that can enhance the overall cardholder experience.
How Two-Year Cost Is Calculated
Two-year cost is used to approximate the monetary value of cards for better comparison and is calculated by combining annual and monthly membership fees over two years, adding any one-time fees or other fees (like balance transfer fees), adding any interest costs, and subtracting rewards. Negative amounts indicate savings. When fees or other terms are presented as a range, we use the midpoint for scoring purposes.
Rewards bonuses and credits have been taken into account for two-year cost calculations. However, bonuses applicable to only a very small portion of cardholders are not considered. For example, credits and bonuses awarded for spending or redeeming rewards through a company portal with non-co-branded cards have not been taken into account. Similarly, bonuses and credits related to spending with specific merchants using a non-co-branded card have not been taken into account (for example, if Card A offers credits with DoorDash, this feature would not be factored into calculations because it is hard to assess how many cardholders would use the benefit or exactly how much value they'd get from it).
Cardholder Spending Profiles
Given that different users have different goals and are likely to use their credit cards differently, we identified spending profiles that are representative of different users’ financial priorities and behaviors. For each cardholder type, we have assumed a specific amount of monthly spending by purchase type (e.g., groceries, gas, etc.), as well as an average balance, balance transfer amount, amount spent on large purchases and average monthly payment. Spending assumptions are based on Bureau of Labor Statistics data for consumers and PEX data for businesses.